Download
1 / 17
170 likes | 350 Views
Damped Lyman α Absorbers. Andrew Northrop. Lyman α Absorber Detection. Broad Lyman α Absorption Lines Determine Type of Lyman α Absorber by Column Density Column Density Verified by UV Spectroscopic Analysis. Lyman α Absorbers by Column Density. Lyman α forest systems:

E N D
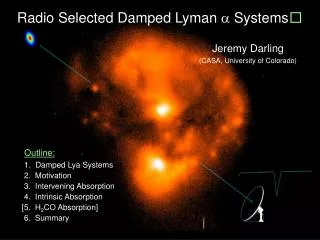
Damped Lyman α Absorbers Andrew Northrop
Lyman α Absorber Detection • Broad Lyman α Absorption Lines • Determine Type of Lyman α Absorber by Column Density • Column Density Verified by UV Spectroscopic Analysis
Lyman α Absorbersby Column Density • Lyman α forest systems: N ≈ 10 atoms cm • Lyman limit systems: N ≈ 10 atoms cm • Damped Lyman α systems (DLAs): N ≈ 10 atoms cm 14 -2 HI 17 -2 HI 20 -2 HI
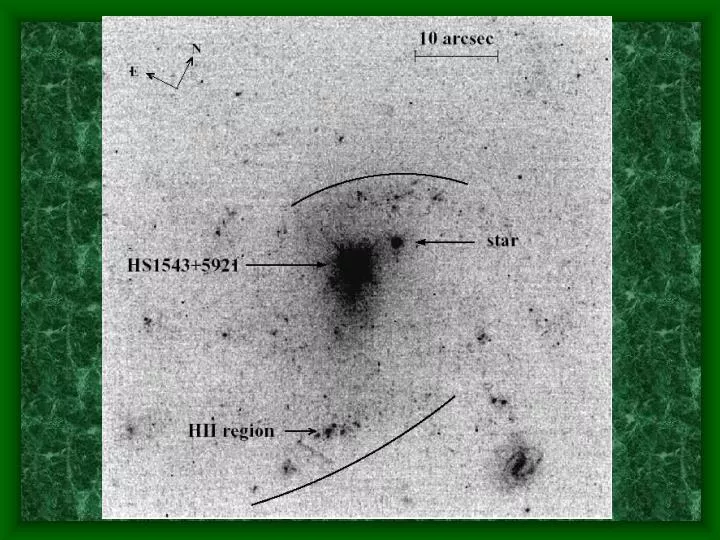
Where Do We FindDamped Lyman α Absorbers? • Along Line of Sight Towards Quasars • Nearest DLA at z = 0.009 (SBS 1543+593) • Furthest DLA at z = 4.383 (Q1202-0725)
DLAs Can Be Used to Chart History of Galaxy Formation Used to Test Cosmological Models DLAs and Galaxy Formation
Early Galaxies and Protogalaxies • DLAs Found with Δv ≥ 40 km s Have Greater Optical Depth at the Edges than in the Middle • DLAs at z < 3 Show Relationship between Higher Velocity Dispersion and Metalicity that Indicates Disk Rotation -1
Circle is Rotating Disk with V = 250 km s Dots are intersection points between sightlines and midplane of disk. Vertical dashed line is sightline for intersection points 1 and 2. Horizontal line is kinematic major axis Rot -1
Does the Data fitSingle-Disk CDM? • Single-Disk CDM Models Cannot Account for Significant Fraction of ∆v between 100 and 300 km s • Median V Predicted by Single-Disk CDM is 100 km s • Truncated, Flat Rotation Curve Model (TF) is Closer Match to Velocity Profiles -1 Rot -1
More Evidence ForRotating Disks • Lack of Metal-Poor DLAs with ∆v ≥ 100 km s Supports Rotating Disk Model • Low [Fe/H] at Low ∆v Due to Low [Fe/H] at Large Radii • High [Fe/h] at Low Impact Parameter Due to High [Fe/H] in Disks that are More Face-On -1
DLAs As Clustered Gas Clouds • DLAs in Under-dense Regions Likely to Be Galaxies • DLAs in Over-dense Regions Likely to Be Superpositions of Small Gas Clouds into Large Halos
DLA in an Over-dense Region Distribution of Lyman Break Galaxies around a DLA
Nearby DLAs • Nearby DLAs (z ≤ 1) are Galaxies • DLA at z = 0.0912 Along Sight-Line Toward Quasar OI 363 is a Low Surface Brightness Galaxy • DLA at z = 0.2212 is a Dwarf Spiral Galaxy
K-band measurement. Quasar is at z = 0.63; G1 is DLA at z = 0.22; Arm and Jet are presumably from DLA at z = 0.09
Radial Brightness Plotted and Fitted to Profiles for (a) Pure r Bulge, (b) Pure Exponential (Disk), (c) and Bulge + Disk G1 Is Bulge + Disk 1/4 Isophotal Plot; faintest isophote is 3σ above background