Download
1 / 83
830 likes | 892 Views
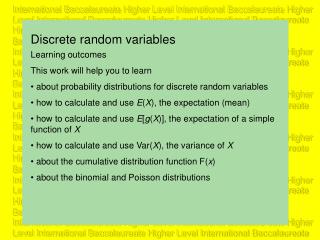
Learn about discrete random variables, probability distributions, Bernoulli and Binomial distributions, and other important concepts in probability theory using clear explanations and examples.

E N D
Discreterandom variables For a discrete random variable X the probability distribution is described by the probability function, p(x), which has the following properties :
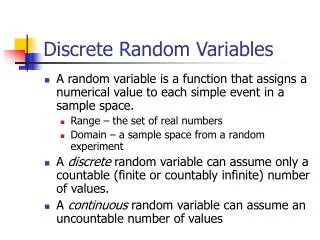
Comment: • For a discrete random variable the number of possible values (i.e. x such that p(x) > 0) is either finite or countably infinite (in a 1-1 correspondence with positive integers.)
Recall p(x) = P[X = x] = the probability function of X. This can be defined for any random variable X. For a continuous random variable p(x) = 0 for all values of X. Let SX ={x| p(x) > 0}. This set is countable (i. e. it can be put into a 1-1 correspondence with the integers} SX ={x| p(x) > 0}= {x1, x2, x3, x4, …} Thus let
Proof: (thatthe set SX ={x| p(x) > 0} is countable) (i. e. can be put into a 1-1 correspondence with the integers} SX = S1 S2 S3 S3 … where i. e.
Thus the elements of SX = S1 S2 S3 S3 … can be arranged {x1, x2, x3, x4, … } by choosing the first elements to be the elements of S1 , the next elements to be the elements of S2 , the next elements to be the elements of S3 , the next elements to be the elements of S4 , etc This allows us to write
A Discrete Random Variable A random variable X is called discrete if That is all the probability is accounted for by values, x, such that p(x) > 0.
Discrete Random Variables For a discrete random variable X the probability distribution is described by the probability function p(x), which has the following properties
Graph: Discrete Random Variable p(x) b a
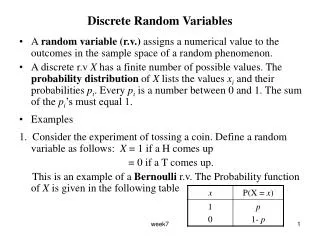
Success (S) • Failure (F) Suppose that we have a experiment that has two outcomes These terms are used in reliability testing. Suppose that p is the probability of success (S) and q = 1 – p is the probability of failure (F) This experiment is sometimes called a Bernoulli Trial Let Then
The probability distribution with probability function is called the Bernoulli distribution p q = 1- p
Success (S) • Failure (F) Suppose that we have a experiment that has two outcomes (A Bernoulli trial) Suppose that p is the probability of success (S) and q = 1 – p is the probability of failure (F) Now assume that the Bernoulli trial is repeated independently n times. Let Note: the possible valuesof X are {0, 1, 2, …, n}
For n = 5 the outcomes together with the values of X and the probabilities of each outcome are given in the table below:
For n = 5 the following table gives the different possible values of X, x, and p(x) = P[X = x]
For general n, the outcome of the sequence of n Bernoulli trails is a sequence of S’s and F’s of length n. SSFSFFSFFF…FSSSFFSFSFFS • The value of X for such a sequence is k = the number of S’s in the sequence. • The probability of such a sequence is pkqn – k( a p for each S and a q for each F) • There are such sequences containing exactly k S’s • is the number of ways of selecting the k positions for the S’s. (the remaining n – k positions are for the F’s
Thus These are the terms in the expansion of (p + q)n using the Binomial Theorem For this reason the probability function is called the probability function for the Binomial distribution
Summary We observe a Bernoulli trial (S,F)n times. Let X denote the number of successes in the n trials. Then X has a binomial distribution, i. e. where • p = the probability of success (S), and • q = 1 – p = the probability of failure (F)
Example A coin is tossed n= 7 times. Let X denote the number of heads (H) in the n = 7 trials. Then X has a binomial distribution, with p = ½ and n = 7. Thus
p(x) x
Example If a surgeon performs “eye surgery” the chance of “success” is 85%. Suppose that the surgery is perfomed n = 20 times Let X denote the number of successful surgeries in the n = 20 trials. Then X has a binomial distribution, with p = 0.85 and n = 20. Thus
p(x) x
The probability that at least sixteen operations are successful = P[X ≥ 16] = p(16) + p(17) + p(18) + p(19) + p(20) = 0.1821 + 0.2428 + 0.2293 + 0.1368 + 0.0388 = 0.8298
Other discrete distributions Poisson distribution Geometric distribution Negative Binomial distribution Hypergeometric distribution
The Poisson distribution • Suppose events are occurring randomly and uniformly in time. • Let X be the number of events occuring in a fixed period of time. Then X will have a Poisson distribution with parameter l.
Some properties of the probability function for the Poisson distribution with parameter l.
is the probability function for the Binomial distribution with parameters n and p, and we allow n→ ∞ and p →0 such that np = a constant (= lsay) then • If
Suppose Proof:
Now Now using the classic limit
Graphical Illustration Suppose a time interval is divided into n equal parts and that one event may or may not occur in each subinterval. n subintervals time interval - Event occurs X = # of events is Bin(n,p) - Event does not occur As n→∞, events can occur over the continuous time interval. X = # of events is Poisson(l)
Example The number of Hurricanes over a period of a year in the Caribbean is known to have a Poisson distribution with l = 13.1 Determine the probability function of X. Compute the probability that X is at most 8. Compute the probability that X is at least 10. Given that at least 10 hurricanes occur, what is the probability that X is at most 15?
Solution • X will have a Poisson distribution with parameter l = 13.1, i.e.
The Geometric distribution Suppose a Bernoulli trial (S,F) is repeated until a success occurs. Let X = the trial on which the first success (S) occurs. Find the probability distribution of X. Note: the possible values of X are {1, 2, 3, 4, 5, … } The sample space for the experiment (repeating a Bernoulli trial until a success occurs is: S = {S, FS, FFS, FFFS, FFFFS, … , FFF…FFFS, …} (x – 1) F’s p(x) =P[X = x] = P[{FFF…FFFS}] = (1 – p)x – 1p
P[X = x] = p(x) = p(1 – p)x – 1 = pqx – 1 Thus the probability function of X is: A random variable X that has this distribution is said to have the Geometric distribution. Reason p(1) = p, p(2) = pq, p(3) = pq2 , p(4) = pq3 , … forms a geometric series
The Negative Binomial distribution Suppose a Bernoulli trial (S,F) is repeated until k successes occur. Let X = the trial on which the kth success (S) occurs. Find the probability distribution of X. Note: the possible values of X are {k, k + 1, k + 2, k + 3, 4, 5, … } The sample space for the experiment (repeating a Bernoulli trial until k successes occurs) consists of sequences of S’s and F’s having the following properties: • each sequence will contain k S’s • The last outcome in the sequence will be an S.
A sequence of length x containing exactly k S’s SFSFSFFFFS FFFSF … FFFFFFS The last outcome is an S The # of S’s in the first x – 1 trials is k – 1. The # of ways of choosing from the first x – 1 trials, the positions for the first k – 1 S’s. The probability of a sequence containing k S’s and x – k F’s.
The Hypergeometric distribution Suppose we have a population containing N objects. Suppose the elements of the population are partitioned into two groups. Let a = the number of elements in group A and let b = the number of elements in the other group (group B). Note N = a+ b. Now suppose that n elements are selected from the population at random. Let X denote the elements from group A. (n – X will be the number of elements from group B.) Find the probability distribution of X.\
Population GroupB(b elements) Group A (a elements) N - x x sample(n elements)
The number of ways x elements can be chosen Group A . The number of ways n - x elements can be chosen Group B . Thus the probability function of X is: The total number of ways n elements can be chosen from N = a + b elements A random variable X that has this distribution is said to have the Hypergeometric distribution. The possible values of X are integer values that range from max(0,n – b) to min(n,a)
Discrete distributions The Bernoulli distribution
The Binomial distribution p(x) x X = the number of successes in n repetitions of a Bernoulli trial p = the probability of success
The Poisson distribution Events are occurring randomly and uniformly in time. X = the number of events occuring in a fixed period of time.
The Geometric DistributionThe Negative Binomial Distribution The Binomial distribution the Bernoulli trials are repeated independently a fixed number of times n and X = the numbers of successes The Negative Binomial distribution the Bernoulli trials are repeated independently until a fixed number, k, of successes has occurred and X = the trial on which the kth success occurred. The Binomial distribution, the Geometric distribution and the Negative Binomial distribution each arise when repeating independently Bernoulli trials The Geometric distribution the Bernoulli trials are repeated independently the first success occurs (,k = 1) and X = the trial on which the 1st success occurred.
The Geometric distribution Suppose a Bernoulli trial (S,F) is repeated until a success occurs. Let X = the trial on which the first success (S) occurs. Find the probability distribution of X. Note: the possible values of X are {1, 2, 3, 4, 5, … } The sample space for the experiment (repeating a Bernoulli trial until a success occurs is: S = {S, FS, FFS, FFFS, FFFFS, … , FFF…FFFS, …} (x – 1) F’s p(x) =P[X = x] = P[{FFF…FFFS}] = (1 – p)x – 1p
P[X = x] = p(x) = p(1 – p)x – 1 = pqx – 1 Thus the probability function of X is: A random variable X that has this distribution is said to have the Geometric distribution. Reason p(1) = p, p(2) = pq, p(3) = pq2 , p(4) = pq3 , … forms a geometric series
Example Suppose a die is rolled until a six occurs Success = S = {six} , p = 1/6. Failure = F = {no six} q = 1 – p = 5/6. • What is the probability that it took at most 5 rolls of a die to roll a six? • What is the probability that it took at least 10 rolls of a die to roll a six? • What is the probability that the “first six” occurred on an even number toss? • What is the probability that the “first six” occurred on a toss divisible by 3 given that the “first six” occurred on an even number toss?