Download
1 / 19
190 likes | 191 Views
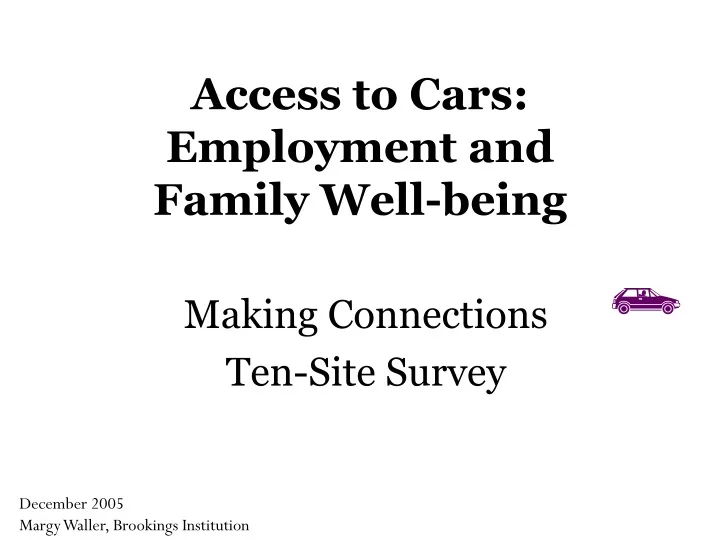
This study examines the impact of car ownership on employment and family well-being in ten different cities. The findings show that access to a car has significant effects on employment outcomes, use of services, access to education, financial assets and status, and community involvement.

E N D
Making Connections Ten-Site Survey Access to Cars: Employment and Family Well-being December 2005 Margy Waller, Brookings Institution
National survey includes the following ten places: Denver, Des Moines, Hartford, Indianapolis, Louisville, Milwaukee, Oakland, Providence, San Antonio, and Seattle Survey conducted 2002 – 2004 7496 respondents in the MC neighborhoods Facts about the Survey
Facts about MC Respondents Gender 65% Male Nearly two-thirds of Making Connections neighborhood respondents were female Female 35% Non-citizens 13% Citizenship Nearly 90 percent of Making Connections neighborhoodrespondents were United States citizens 87% Citizens
Employment Just over half of Making Connections neighborhood respondents were employed 53% Employed 47% Unemployed Facts about MC Respondents Income More than half of Making Connections neighborhood respondents live in households with income under $20,000/year 54% Less than $20k/year More than $20k/year 46%
40% 60% Facts about MC Respondents Education Race/Ethnicity Other College Grad 9% < High school White 13% 28% Black 48% 33% 51% 21% High school Hispanic Living arrangements 7% 2% Asian Native American Not living with spouse or partner Living with spouse or partner
Facts about MC Respondents Household Car Car Reliability Unreliable No car 7% Own car 29% 71% 93% Drivers License Reliable No valid license 31% 69% Has valid license
In the Making Connections neighborhoods, respondents in a household with a vehicle were significantly more likely to… Have high school or GED credential Live with a spouse or partner 70% 49% 48% 18% Own car No car Own car No car Live in a household with income over $20,000 37% 5% Own car No car
School Activities In the Making Connections neighborhoods, respondents with a child who lived in a household with a vehicle… 56% Were more likely to say the child participated in school activities 45% Own car No car 30% Were significantly less likely to cite a transportation-related reason for why the child did NOT participate 22% 22% Own car No car
Less likely to be employed Unemployed for longer periods, on average More likely to have a temporary or seasonal job Less likely to have received a raise in the previous year Less likely to use services like a bank, recreation center, or after school programs Less likely to attend community college Less likely to have a savings or checking account Less likely to be saving for education, retirement, or a home Isolating Effects of Car Ownership Controlling for effects of race, education, income, gender, citizenship, and marital status, survey data show that respondents without cars were significantly:
Employment Outcomes After controlling for demographic factors, respondents without cars were…. Unemployed for significantly longer periods of time, on average Significantly less likely to be employed 25 wks/yr 64% 13 wks/yr 34% No car Own car No car Own car
Employment Outcomes After controlling for demographic factors, respondents without cars…. Were significantly more likelyto have a temporaryorseasonaljob Were significantly less likelyto have received a raisein the previous year 62% 25% 46% 17% No car Own car No car Own car
Use of Services After controlling for demographic factors, respondents without cars were significantly less likely to use…. After-school programs Comm. college or adult ed A recreational center A bank A library
Those without cars reported significantly more difficulty using the supermarket Respondents without cars were significantly less satisfied with recreational centers Access to Services Reasons for Non-Use Respondents without cars were significantly more likely to report a transportation-related problem as the reason for not using: • The supermarket • ATMs • Recreational Centers
To have aphone that works, use a computer, or access to the internet at home PhoneComputerInternet EducationHouseRetirement To have a checking account or a savings account Checking AccountSavings Account Financial Assets and Status After controlling for demographic factors, respondents without carssignificantlyless likely to…. 92% vs.80% 53% vs.22% 78% vs.60% 38% vs.11% 18% vs.8% 20% vs.9% 72% vs.37% 62% vs.31%
Financial Assets and Status After controlling for demographic factors, respondents without carssignificantlyless likely to…. Have a phone that works Use a computer at home 92% 53% 80% 22% Own car No car Own car No car Access the internet at home 78% 60% Own car No car
Financial Assets and Status After controlling for demographic factors, respondents without carssignificantlyless likelyto be saving for…. Education Retirement 17% 36% 7% 11% Own car No car Own car No car A house 19% 9% Own car No car
Financial Assets and Status After controlling for demographic factors, respondents without carssignificantlyless likelyto…. 72% Have a checking account 37% Own car No car 62% Have a savings account 32% Own car No car
Community Involvement After controlling for demographic factors, respondents without carswere significantlyless likely tohave volunteeredin the community in the last year Vehicle in Household No Vehicle 23% Volunteered Volunteered 30% 77% 70% Did not volunteer Did not volunteer
Safety and Neighborhoods After controlling for demographic factors, respondents without cars… Were significantly less likely to feel safe alonein the neighborhood during the day Were significantly less likely to believe their neighborhood was safe for children 80% 36% 75% 33% Own car No car Own car No car 41% 36% Were significantly less likely to report people that from outside the neighborhood came there to shop or do business Own car No car