Download
1 / 22
220 likes | 430 Views
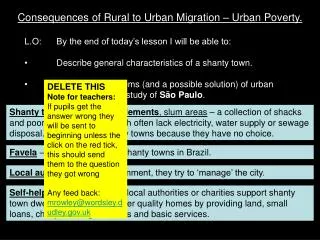
Urban to Rural Evacuation. A Closer Look at Pennsylvania’s Northern Tier By Saskia Cohick. Definition. Urban to Rural Evacuation: The spontaneous movement of a population from an urban area to a suburban or rural area in the event of a natural or man-made disaster.

E N D
Urban to Rural Evacuation A Closer Look at Pennsylvania’s Northern Tier By Saskia Cohick
Definition • Urban to Rural Evacuation: • The spontaneous movement of a population from an urban area to a suburban or rural area in the event of a natural or man-made disaster. • Examples: Hurricane Katrina, Three Mile Island (TMI), September 11 attacks
Background • North Central Task Force (NCTF) • Previous research potential evacuee surge • Emergency Management Agency (EMA) professionals found research predictions inadequate • Reasons • Experience (TMI) • Population characteristics
Previous Research • http://www.cei.psu.edu/evac/about/index.html • Web page includes a web based mapping evacuation planning tool • Links to additional tools to assist emergency evacuation planning
Methods & Assumptions Previous Research • Previous Research: • Nature of event • Likeliness to evacuate • Relative appeal of rural area • Interviews with 17 informants • Previous experiences • National data sets • Used hotel/motel availability
Methods & Assumptions current research • What is the draw of each county • Interviews performed with EMA or 911 Directors/Coordinators and other emergency responders • TMI experiences • Find approach that would utilize best data sources from counties for prediction • Household/property ownership information
Availability of GIS data in NCTF Full Capabilities: Road, Buildings, Hydrology, Parcels, Land Use, Zoning Partial Capabilities: Completed roads, buildings, hydrology and working on parcels and other land classifications Limited Capabilities: Working on completion of basic planimetric layers
Results from the current tool…….Dirty Bomb with % change in population
Results from the current tool…….Dirty Bomb with number of evacuees
What caused the differences? • TMI incident. Respondents indicated total exhaustion of resources. • Food and water resources exhausted • Insufficient housing for all individuals • Fuel shortages reported across the region
Cause for concern………. • Limited Medical Services • Over 93% emergency responders volunteer • Infrastructure • 40% state owned lands – mainly wooded areas
Even if you can’t find them, they will still come.. • Improve estimates • Number of evacuees • Location of evacuees • Create a prediction scenario with structure (building) based information • Obtain more accurate data • # of owners/parcel • State owned land information
Unique considerations… • Non-resident land owners • Evacuate to known locations • Hunting camps and summer or second homes prevalent
The numbers • Total number of residents (2008 estimates) = R • Average number of residents per addressable structure ( 2000 census) = Ar • Number of structures occupied by full time residents = RS • Total number of addressable structures = A • Number of seasonal structures = SS • Number of non-residents possible= NR (R / Ar)=RS A - RS = SS SS * Ar = NR
Expected Evacuees per County On-Line Tool Results
What GIS data layers can help refine calculations • Parcel layer • Road Network • State Land Capacity • Other accommodations
Considerations for next portion of work… • Who is coming? • Owners (plus others?) • What will they bring? • Supplies • Pets • How will they get here? • Roads adequate • Where will they be? • Evacuee population dispersion
Thank you! • Special thanks to Doug Miller, PSU • Great appreciation to all involved counties who provided data and assistance • John Hetrick, Joe Gerhart - Potter County • Kim Barto, Sullivan County • Denny Colegrove, Rob Schwarz – Tioga County • Sue Reese – Union County • Jim Watson – Clinton County • Scott Molnar – Bradford County • Barry Hutchins – Lycoming County
More thanks……. • Thanks also to original researchers: • Tom Briggs, NORC at the University of Chicago • Michael Meit, MA, MPH, NORC at the Univeristy of Chicago • Dr. Donald Rowe, PH.D., Public health Liaison, School of Public Health and Health Professions, University of Buffalo • Stephen Crawford, Penn State University Center for Environmental Informatics.