Download
1 / 20
220 likes | 424 Views
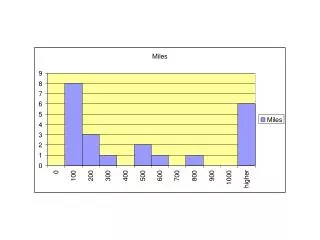
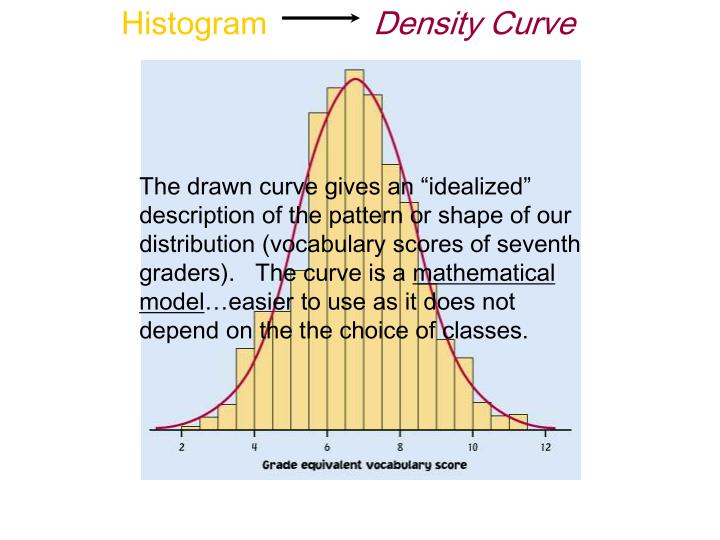
Histogram Density Curve. The drawn curve gives an “idealized” description of the pattern or shape of our distribution (vocabulary scores of seventh graders). The curve is a mathematical model …easier to use as it does not depend on the the choice of classes. Area of bars =

E N D
HistogramDensity Curve The drawn curve gives an “idealized” description of the pattern or shape of our distribution (vocabulary scores of seventh graders). The curve is a mathematical model…easier to use as it does not depend on the the choice of classes.
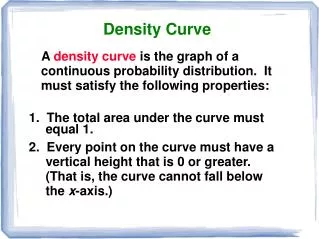
Area of bars = proportion of observations Area under the curve = proportion of observations = DENSITY Area of all bars = 100% of our data Total area under the curve = 100% of our data or proportion =1.
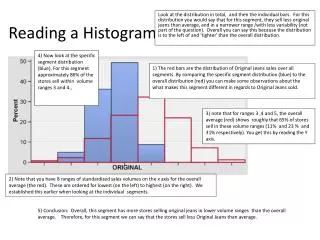
For this data, the proportion of scores below 6 is either the sum of the proportions (areas) of each bar OR the area under the curve to the left of 6.
As we know, mean and median are not equal for skewed distributions For symmetric density curves, mean and median are equal
Median = equal areas point (50%) Mean = “centre of gravity” if the curve were made of stone.
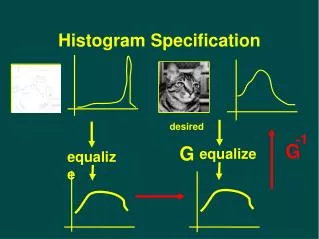
Normal Distributions A class of density curves that are symmetric, single peaked and bell-shaped. Normal distributions are completely determined by the mean (m) and standard deviation (s).
Normal Distributions 1s 2s 3s 3s 2s 1s 68% – 95% – 99.7% Rule
Mean (m) = 176 Standard Deviation (s) = 11 N(176, 11) What percent of the class are between 165 cm & 187cm? Between what heights do 95% of the class fall? What percent of the class is shorter than 154 cm?
Mean (m) = 171 Stand Dev (s) = 10 N (171, 10) What percent of the class are between 161cm & 181cm? Between what heights due 95% of the class fall? What percent of the class is shorter than 151 cm?
Standardising normal distributions… …all normal distributions are the same if we measure in units of size s about the mean m. Z = (x - µ)/ This value, z, is the standardised value of any x in our distribution. The value z is the number of standard deviations the original x (observation) falls away from the mean … and the direction.
Mean (m) = 171 Stand Dev (s) = 10 N (171, 10) Height Data…again What is the standard value, z, for someone with height 183cm? What is the standard value,z, for someone with height 158cm? What do these standard values mean?
Height Data…again Mean (m) = 176 Standard Dev (s) = 11 N(176, 11) What is the standard value, z, for someone with height 195 cm? What is the standard value,z, for someone with height 165 cm? What do these standard values mean?
Z=0.00 Area to left of 0.00 is 0.50 (50%) z .00 .01 .02 .03 …….. .5000 .5040 .5080 .5120 .5398 .5438 .5478 .5517 .5793 .5832 .5871 .5910 .9987 .9987 .9987 .9988 Using the standard normal distribution: The standard normal table (inside your textbook’s front cover) gives the area under the curve for the standard normal distribution (z). 0.0 0.1 0.2 . 3.0 . Z=3.00 Area to the left is .9987
Example 1.15 pg 58 (a) Finding a proportion (area) given a value (b)
Finding proportions based on the normal distribution: • State the problem in terms of the observed variable x. • Draw a picture. • Standarise x to restate the problem in terms of a standard normal variable , z. • Find the area under the standard normal curve using Table A based on your z, and the fact that the total area under the curve equals 1.
Example 1.16 pg 59 Finding a proportion (area) given a value
Finding values based on the proportion of a normal distribution: • State the problem in terms of the observed variable x. • Draw a picture. • Find the closest value in the body of Table A to your given proportion then note the corresponding value of z. • Unstandardise … x = m + zs
Area to left of 0.00 is 0.50 (50%) z .00 .01 .02 .03 …….. .5000 .5040 .5080 .5120 .5398 .5438 .5478 .5517 .5793 .5832 .5871 .5910 .9987 .9987 .9987 .9988 Z = 0.0 0.0 0.1 0.2 . 3.0 . . Area to the left is .9987 Z=3.00
Example 1.18 pg 61 Finding a value given a proportion (area)