Download
1 / 6
80 likes | 448 Views
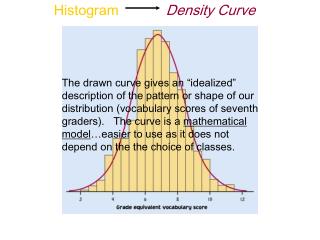
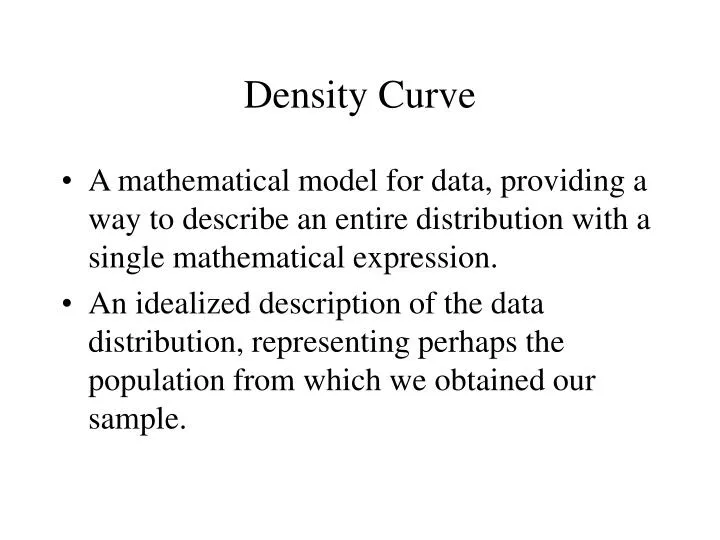
Density Curve. A mathematical model for data, providing a way to describe an entire distribution with a single mathematical expression. An idealized description of the data distribution, representing perhaps the population from which we obtained our sample. Properties of a Density Curve.

E N D
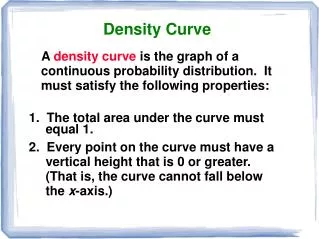
Density Curve • A mathematical model for data, providing a way to describe an entire distribution with a single mathematical expression. • An idealized description of the data distribution, representing perhaps the population from which we obtained our sample.
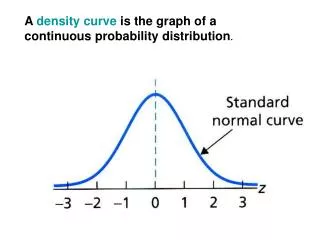
Properties of a Density Curve • Always on or above the horizontal axis. • The total area under the curve is exactly 1. • The area under the curve for a given horizontal range is the relative frequency of observations in that range for the idealized (population) distribution.
m and s • The mean of a density curve is denoted by the Greek letter m. • The standard deviation of a density curve is denoted by the Greek letter s.
Normal Distributions • Symmetric • Single-peaked (i.e., unimodal) • Bell-shaped • Exact form for a particular normal distribution is specified by m and s.
The 68-95-99.7 Rule • In any normal distribution: • 68 % of the individuals fall within 1s of m. • 95 % of the individuals fall within 2s of m. • 99.7 % of the individuals fall within 3s of m.