Download
1 / 12
130 likes | 221 Views
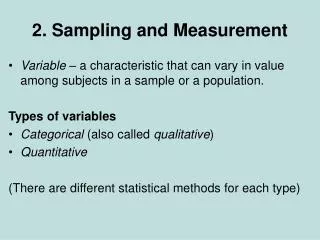
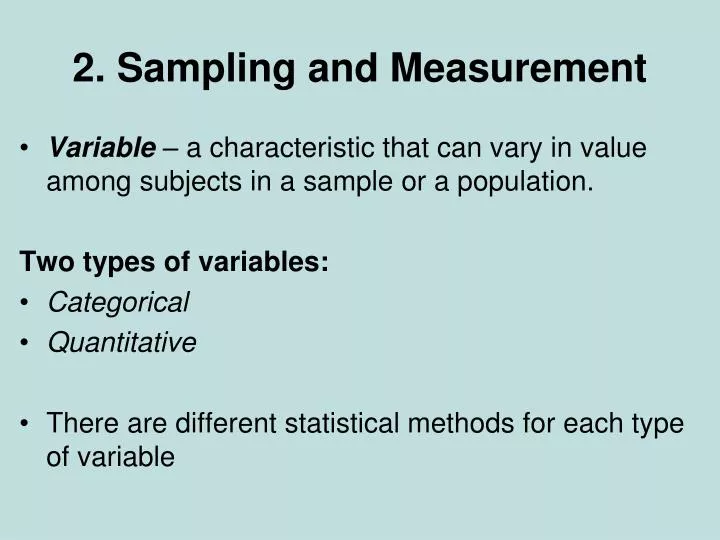
2. Sampling and Measurement. Variable – a characteristic that can vary in value among subjects in a sample or a population. Two types of variables: Categorical Quantitative There are different statistical methods for each type of variable.

E N D
2. Sampling and Measurement • Variable – a characteristic that can vary in value among subjects in a sample or a population. Two types of variables: • Categorical • Quantitative • There are different statistical methods for each type of variable
Categorical variable – scale for measurement is a set of categories Examples: • Vegetarian? (yes, no) • Happiness (very happy, pretty happy, not too happy) Quantitative variable – possible values differ in magnitude Examples: • Age, height, weight • Annual income • Time spent on Internet yesterday
Variable A characteristic that can vary in value among subjects in a sample or a population. • Categorical • Quantitative subject gen age high colltv veg party ideology abor 1 m 32 2.2 3.5 3 n r 6 n 2 f 23 2.1 3.5 15 y d 2 y 3 f 27 3.3 3.0 0 y d 2 y 4 f 35 3.5 3.2 5 n i 4 y 5 M 23 3.1 3.5 6 n i 1 y
Scales of measurement Two types of categorical variables: • Nominal scale – unordered categories • Race, Gender, Vegetarian (yes / no) • Ordinal scale – ordered categories • Happiness (very happy, pretty happy, not too happy) • Government spending on environment (up, same, down)
For quantitative variables, the set of possible values is called an interval scale. (i.e., numerical interval between each possible pair of values) Note: In practice, ordinal categorical variables often treated as interval by assigning scores Level of agreement is an ordinal scale, but treated as interval if assigned scores 4=Totally agree, 3=Agree, 2=Disagree ,1=Totally disagree. Ordering of variable types from highest to lowest level of differentiation among levels: • interval > ordinal > nominal
Another classification: Discrete / Continuous Discrete variable – possible values a set of separate numbers, such as 0, 1, 2, … Example: Number of … e-mail messages sent in previous day Continuous variable – infinite continuum of possible values Example: Amount of time spent on Internet in previous day (In practice, distinction often blurry)
What type of variable? Variable: • No. of movies seen this summer (0, 1, 2, 3, 4, …) • Favorite music type of (rock, jazz, folk, classical) • Happiness (very happy, pretty happy, not too happy) • Quantitative or categorical? • Nominal, ordinal, or interval scale? • Continuous or discrete?
Randomization – the mechanism for achieving reliable data by reducing potential bias • NotationN = Population sizen = sample size • Simple Random Sample, SRS: In a sample survey, each possible sample of size n has same chance of being selected. • SRS is an example of a probability samplingmethod – We can specify the probability any particular sample will be selected.
How to do random sampling • Establish a sampling frame (listing of all subjects in population) must exist to implement simple random sampling • Use statistical software to generaterandom numbers. • Other probabilitysampling methods:Systematic, stratifiedand cluster random sampling.
Sampling error • The sampling error of a statistic equals the error that occurs when we use a sample statistic to predict the value of a population parameter. • Randomization protects against bias, with sampling error tending to fluctuate around 0 with predictable size • The direction and the extent of bias is unknown for studies that cannot employ randomization.
Other factors besides sampling error can cause results to vary from sample to sample: • Sampling bias (e.g., nonprobability sampling) • Response bias (e.g., poorly worded questions, such as Lou Dobbs poll mentioned above and others at loudobbsradio.com/surveyarchive) • Nonresponse bias (undercoverage, missing data) Read pages 19-21 of text for examples
For nonprobability sampling, we cannot specify the probabilities for the possible samples. Inferences based on them are (highly) unreliable. • Example: volunteer samples, such as polls on the Internet, often are severely biased. • (But, sometimes volunteer samples are all we can get, as in most medical studies)