Download
1 / 61
610 likes | 795 Views
L2 and L1 Criteria for K-Means Bilinear Clustering. B. Mirkin School of Computer Science Birkbeck College, University of London

E N D
L2 and L1 Criteria for K-Means Bilinear Clustering B. Mirkin School of Computer Science Birkbeck College, University of London Advert of a Special Issue: The ComputerJournal, Profiling Expertise and Behaviour: Deadline 15 Nov. 2006. To submit, http:// www.dcs.bbk.ac.uk/~mark/cfp_cj_profiling.txt
Outline: More of Properties than Methods • Clustering, K-Means and Issues • Data recovery PCA model and clustering • Data scatter decompositions for L2 and L1 • Contributions of nominal features • Explications of Quadratic criterion • One-by-one cluster extraction: Anomalous patterns and iK-Means • Issue of the number of clusters • Comments on optimisation problems • Conclusion and future work
WHAT IS CLUSTERING; WHAT IS DATA • K-MEANS CLUSTERING: Conventional K-Means; Initialization of K-Means; Intelligent K-Means; Mixed Data; Interpretation Aids • WARD HIERARCHICAL CLUSTERING: Agglomeration; Divisive Clustering with Ward Criterion; Extensions of Ward Clustering • DATA RECOVERY MODELS: Statistics Modelling as Data Recovery; Data Recovery Model for K-Means; for Ward;Extensions to Other Data Types; One-by-One Clustering • DIFFERENT CLUSTERING APPROACHES: Extensions of K-Means; Graph-Theoretic Approaches; Conceptual Description of Clusters • GENERAL ISSUES: Feature Selection and Extraction; Similarity on Subsets and Partitions; Validity and Reliability
Clustering, K-Means and Issues • Bilinear PCA model and clustering • Data Scatter Decompositions: Quadratic and Absolute • Contributions of nominal features • Explications of Quadratic criterion • One-by-one cluster extraction: Anomalous patterns and iK-Means • Issue of the number of clusters • Comments on optimisation problems • Conclusion and future work
Example: W. Jevons (1857) planet clusters, updated (Mirkin, 1996) Pluto doesn’t fit in the two clusters of planets: originated another cluster (2006)
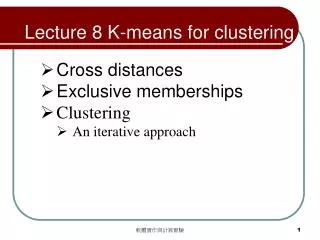
Clustering algorithms • Nearest neighbour • Ward’s • Conceptual clustering • K-means • Kohonen SOM • Spectral clustering • ………………….
K-Means: a generic clustering method Entities are presented as multidimensional points (*) 0. Put K hypothetical centroids (seeds) 1. Assign points to the centroids according to minimum distance rule 2. Put centroids in gravity centres of thus obtained clusters 3. Iterate 1. and 2. until convergence K= 3 hypothetical centroids (@) • * * • * * * * * • * * * • @ @ • @ • ** • * * *
K-Means: a generic clustering method Entities are presented as multidimensional points (*) 0. Put K hypothetical centroids (seeds) 1. Assign points to the centroids according to Minimum distance rule 2. Put centroids in gravity centres of thus obtained clusters 3. Iterate 1. and 2. until convergence • * * • * * * * * • * * * • @ @ • @ • ** • * * *
K-Means: a generic clustering method Entities are presented as multidimensional points (*) 0. Put K hypothetical centroids (seeds) 1. Assign points to the centroids according to Minimum distance rule 2. Put centroids in gravity centres of thus obtained clusters 3. Iterate 1. and 2. until convergence • * * • * * * * * • * * * • @ @ • @ • ** • * * *
K-Means: a generic clustering method Entities are presented as multidimensional points (*) 0. Put K hypothetical centroids (seeds) 1. Assign points to the centroids according to Minimum distance rule 2. Put centroids in gravity centres of thus obtained clusters 3. Iterate 1. and 2. until convergence 4. Output final centroids and clusters * * @ * * * @ * * * * ** * * * @
Advantages of K-Means Models typology building Computationally effective Can be utilised incrementally, `on-line’ Shortcomings (?) of K-Means Initialisation affects results Convex cluster shape
Initial Centroids: Correct Two cluster case
Initial Centroids: Correct Final Initial
Different Initial Centroids: Wrong Initial Final
Issues: • K-Means gives no advice on: • *Number of clusters • * Initial setting • * Data normalisation • * Mixed variable scales • * Multiple data sets • K-Means gives limited advice on: • *Interpretation of results • These all can be addressed with the data recovery approach
Clustering, K-Means and Issues • Data recovery PCA model and clustering • Data Scatter Decompositions: Quadratic and Absolute • Contributions of nominal features • Explications of Quadratic criterion • One-by-one cluster extraction: Anomalous patterns and iK-Means • Issue of the number of clusters • Comments on optimisation problems • Conclusion and future work
Type of Data Similarity Temporal Entity-to-feature Type of Model Regression Principal components Clusters Data recovery for data mining (discovery of patterns in data) • Model: • Data = Model_Derived_Data + Residual • Pythagoras: • |Data|m = |Model_Derived_Data|m + |Residual|m • m =1, 2. The better fit, the better the model: a natural source of optimisation problems
Representing a partition Clusterk: Centroid ckv (v - feature) Binary 1/0 membership zik (i - entity)
Basic equations (same as for PCA, but score vectors zk constrained to be binary) y – data entry, z – 1/0 membership, not score c - cluster centroid, N – cardinality i - entity, v - feature /category, k - cluster
Clustering: general and K-Means • Bilinear PCA model and clustering • Data Scatter Decompositions L2 and L1 • Contributions of nominal features • Explications of Quadratic criterion • One-by-one cluster extraction: Anomalous patterns and iK-Means • Issue of the number of clusters • Comments on optimisation problems • Conclusion and future work
Quadratic data scatter decomposition (classic) K-means: Alternating LS minimisation y – data entry, z – 1/0 membership c - cluster centroid, N – cardinality i - entity, v - feature /category, k - cluster
Absolute Data Scatter Decomposition (Mirkin 1997) Ckvare medians
Outline • Clustering: general and K-Means • Bilinear PCA model and clustering • Data Scatter Decompositions L2 and L1 • Implications for data pre-processing • Explications of Quadratic criterion • One-by-one cluster extraction: Anomalous patterns and iK-Means • Issue of the number of clusters • Comments on optimisation problems • Conclusion and future work
Meaning of the Data scatter • m=1,2; The sum of contributions of features – the basis for feature pre-processing (dividing by range rather than std) • Proportional to the summary variance (L2) / absolute deviation from the median (L1)
Standardisation of features • Yik = (Xik –Ak)/Bk • X - original data • Y – standardised data • i – entities • k – features • Ak – shift of the origin, typically, the average • Bk – rescaling factor, traditionally the standard deviation, but range may be better in clustering
B1=Std1 << B2= Std2 Normalising • by std decreases the effect of more useful feature 2 • by range keeps the effect of distribution shape in T(Y): B = range*#categories (for L2 case) (under the equality-of-variables assumption)
Categories as one/zero variables Subtracting the average All features: Normalising by range Categories - sometimes by the number of them Data standardisation
Illustration of data pre-processing Mixed scale data table
No normalisation Tom Sawyer
Z-scoring (scaling by std) Tom Sawyer
Normalising by range*#categories Tom Sawyer
Outline • Clustering: general and K-Means • Bilinear PCA model and clustering • Data Scatter Decompositions: Quadratic and Absolute • Contributions of nominal features • Explications of Quadratic criterion • One-by-one cluster extraction: Anomalous patterns and iK-Means • Issue of the number of clusters • Comments on optimisation problems • Conclusion and future work
Contribution of a feature Fto a partition (m=2) • Proportional to • correlation ratio 2 if F is quantitative • a contingency coefficient between cluster partition and F, if F is nominal: • Pearson chi-square (Poisson normalised) • Goodman-Kruskal tau-b (Range normalised) Contrib(F) =
Contribution of a quantitative feature to a partition (m=2) • Proportional to • correlation ratio 2 if F is quantitative
Contribution of a pair nominal feature – partition, L2 case • Proportional to a contingency coefficient • Pearson chi-square (Poisson normalised) • Goodman-Kruskal tau-b (Range normalised) Bj=1 • Still needs be normalised by the square root of #categories, to balance the contribution of a numerical feature
Contribution of a pair nominal feature – partition, L1 case • A highly original contingency coefficient • Still needs be normalised by square root of #categories, to balance the contribution of a numerical feature
Clustering: general and K-Means • Bilinear PCA model and clustering • Data Scatter Decompositions: Quadratic and Absolute • Contributions of nominal features • Explications of Quadratic criterion • One-by-one cluster extraction: Anomalous patterns and iK-Means • Issue of the number of clusters • Comments on optimisation problems • Conclusion and future work
Equivalent criteria (1) A. Bilinear residuals squared MIN Minimizing difference between data and cluster structure B. Distance-to-Centre Squared MIN Minimizing difference between data and cluster structure
Equivalent criteria (2) C. Within-group error squared MIN Minimizing difference between data and cluster structure D. Within-group variance Squared MIN Minimizing within-cluster variance
Equivalent criteria (3) E. Semi-averaged within distance squared MIN Minimizing dissimilarities within clusters F. Semi-averaged within similarity squared MAX Maximizing similarities within clusters
Equivalent criteria (4) G. Distant Centroids MAX Finding anomalous types H. Consensus partition MAX Maximizing correlation between sought partition and given variables
Equivalent criteria (5) I. Spectral Clusters MAX Maximizing summary Raileigh quotient over binary vectors
Gower’s controversy: 2N+1 entities c1 c2 c3 N N 1 • Two-cluster possibilities • W(c1,c2/c3)= N2 d(c1,c2) • W(c1/c2,c3)= N d(c2,c3) • W(c1/c2,c3)=o(W(c1,c2/c3)) Separation over grand mean/median rather than just over distances (in the most general d setting)
Outline • Clustering: general and K-Means • Bilinear PCA model and clustering • Data Scatter Decompositions: Quadratic and Absolute • Contributions of nominal features • Explications of Quadratic criterion • One-by-one cluster extraction strategy: Anomalous patterns and iK-Means • Comments on optimisation problems • Issue of the number of clusters • Conclusion and future work
PCA inspired Anomalous Pattern Clustering yiv =cv zi + eiv, where zi = 1 ifiS, zi = 0 ifiS With Euclidean distance squared cS must be anomalous, that is, interesting
Spectral clustering can be not optimal (1) • Spectral clustering (becoming popular, in a different setting): • Find maximum eigenvector by maximising over all possible x • Define zi=1 if xi>a ; zi=0, if xi a, for some a
Spectral clustering can be not optimal (2) • Example (for similarity data): 1 2 6 19 20 3 4 5 z | 0.681 0.260 0.126 0.168 | i | 1 2 3-5 6-20 This cannot be typical…