Download
1 / 10
110 likes | 247 Views
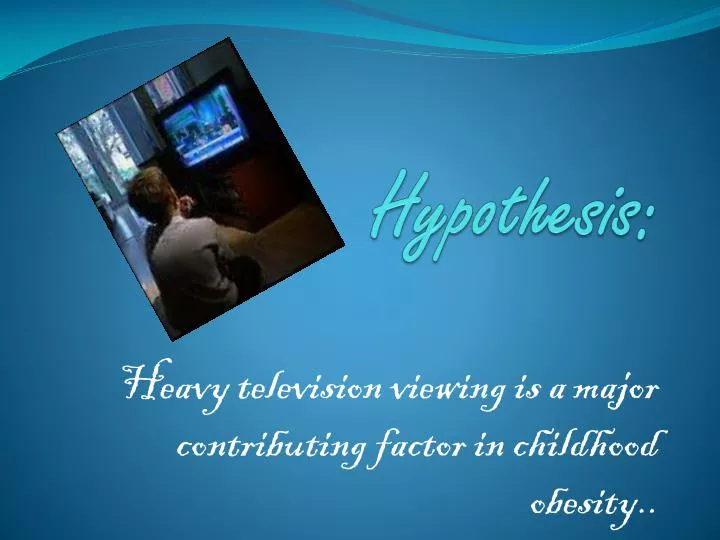
Hypothesis:. Heavy television viewing is a major contributing factor in childhood obesity. Average Family Viewing. Average number of televisions per household: 2.24 66% of American homes have three or more TV sets 1 in 3 children have televisions in their bedrooms

E N D
Hypothesis: Heavy television viewing is a major contributing factor in childhood obesity..
Average Family Viewing • Average number of televisions per household: 2.24 • 66% of American homes have three or more TV sets • 1 in 3 children have televisions in their bedrooms • 44% of parents believe they watch too much television • 66% of families watch television while eating • The average child watches 4 hours of television daily/ 0r 28 hours per week/or 2 months of continuous watching yearly
Play vs. Television Playing TV watching
When asked if they would rather spend time with family or watch television, children responded: 54% preferred television 54% would rather watch TV
Television Ads aimed at children promote unhealthy eating habits Advertisers target children and research shows that while watching TV children snack on high-fat, high calorie junk foods and sugar beverages. Consumption of calories are highest at this time.
Since television has become commonplace in homes, childhood obesity rates have increased significantly! 2008 1960 1950
Obesity Rates in Children Since 1960 Obesity ranges are determined by using weight and height to calculate a number called the “body mass index” (BMI) BMI correlates with an individual’s amount of body fat.
Data for obesity trends and television viewing are well correlated 1950 80’ 08’ Correlation coefficient .901412
Heavy television viewing is contributing to childhood obesity! • Television viewing effects: • replace time children spend doing physical activities • contribute to increased calorie consumption through snacking and eating meals in front of the TV • influence children to make unhealthy food choices through exposure to junk-food advertisements • lower children's metabolic rate As a result, childhood obesity is regarded as the most common prevalent nutritional disorder of US children and adolescents, and one of the most common problems seen by pediatricians. Overweight children have a 70% chance of becoming obese adults!
Sources: http://www.ohiopha.org/Member/Obesity/index.htm http://www.csun.edu/science/health/docs/tv&health.html#influence http://www.med.umich.edu/1libr/yourchild/tv.htm http://kidshealth.org/parent/positive/family/tv_affects_child.html http://www.obesitydiscussion.com/forums/childhood-obesity- statistics/children-s-time-watching-tv-731.html http://www.obesity.org/news/archive/20011010a.asp http://www.cdc.gov/nccdphp/dnpa/obesity/childhood/contributing_factors.htm