Download
1 / 49
490 likes | 575 Views
Estimated Stream Depletion in the Nebraska Platte Basin due to New Irrigated Land after 07/01/1997. Prepared by the Cooperative Hydrology Study (COHYST) for the Nebraska Department of Natural Resources (DNR) July 2006. Outline of Presentation. Mapping irrigated land

E N D
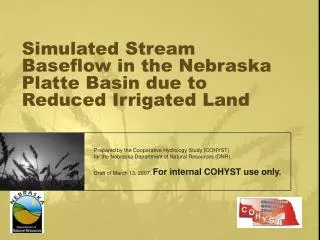
Estimated Stream Depletion in the Nebraska Platte Basin due to New Irrigated Land after 07/01/1997 Prepared by the Cooperative Hydrology Study (COHYST) for the Nebraska Department of Natural Resources (DNR) July 2006
Outline of Presentation • Mapping irrigated land • Determining changes in irrigated land • Table of changes in irrigated land • Determining net irrigation requirement • Groundwater flow models used in analysis • How new depletions are determined
Outline (continued) • Map of reaches used in analysis • New depletions by reach • New depletions from the Hydrologically Connected Area for the Overappropiated Basins (HCA/OA) and Eastern Analysis Area (EAA)
Mapping Irrigated Land • CALMIT – Center for Advanced Land Management Information Technologies • University of Nebraska – Lincoln • Patti Dappen • http://www.calmit.unl.edu
1997 (COHYST) Ogallala Keith County
1997 (continued) Kearney Kearney County
2001 (COHYST) Ogallala Keith County
2001 (continued) Kearney Kearney County
2005 (DNR) Ogallala Keith County
2005 (continued) Kearney Kearney County
Changes in Irrigated Land • DNR processed 1997, 2001, and 2005 irrigated land maps to get changes in irrigated land • 2001 - 1997 = 1997-01 gained irrigated land • 1997 - 2001 = 1997-01 lost irrigated land • 2005 - 2001 = 2001-05 gained irrigated land • 2001 - 2005 = 2001-05 lost irrigated land
Change (continued) • Ignored surface-water irrigated areas • Parcels < 1.0 acre eliminated • Edge effects eliminated Examples of edge effects Green is gained irrigated land Red is lost irrigated land
1997-01 Change Gained irrigated land Lost irrigated land Keith County
1997-01 Change (continued) Gained irrigated land Lost irrigated land Kearney County
2001-05 Change Lost irrigated land Gained irrigated land Corners gained Keith County
2001-05 Change (continued) Lost corners Lost irrigated land Gained irrigated land Kearney County
Summary of changes • 1997-01 • 282,780 irrigated acres gained • 78,380 irrigated acres lost • 204,400 acres net gain • 2001-05 • 383,780 irrigated acres gained • 80,170 irrigated acres lost • 303,610 acres net gain • 1997-05 net gain 508,010 acres
Net Irrigation Requirement1997-2038 • NIR was computed by CropSim • NIR was based on 1997-98 meteorological conditions • 1997 was slightly dryer than 104-year average (-0.47 inches) • Range was +0.76 inches (Climate Division 1) to -1.98 inches (Climate Division 6) • NIR was based on 1997-98, 2001-02, and 2005-06 crop mix • NIR was held constant for 2005-38 • NIR was averaged by Model Unit
NIR (continued) Model Units for NIR Note model overlap Note areas of model overlap
GW Models used in Analysis • 160 acre cell size • WMU 1 layer; CMU 6 layers; EMU 5 layers • Calibrated to pre-1950 and 1950-98 conditions • Peer reviewed by Eagle Resources • Priority items from peer review incorporated into models • Models are reasonable representation of actual conditions • Models are adequate to estimate effects of gained or lost irrigated land on baseflow to streams
How Models Were Used for this Analysis • Models were run for 40 years • May 1, 1998 through April 30, 2038 • Models produced a water budget at the end of each month • Models were first run without any change in irrigated land using average 1995-97 recharge and 1997 pumpage – Baseline Condition
Models (continued) • New pumpage was based on product of change in irrigated acres and net irrigation requirement • Acres in 1997, 2001, and 2005 were from CALMIT maps • Changes in acres between 1997, 2001, and 2005 were interpolated based on well registrations • Changes in net irrigation requirement between 1997, 2001, and 2005 were linear interpolations
Models (continued) • Pumpage was added to the model for gained irrigated land • Pumpage was removed from the model for lost irrigated land • Pumpage for May 1, 2005 through April 30, 2006 was repeated each year thereafter • No extrapolation of new irrigated land after 2005 • Reasonable because of stays on new irrigated land
Models (continued) • Models were run with pumpage representing changes in irrigated land – Added Pumpage Condition • Added pumpage condition was compared to Baseline condition to determine net depletion to stream baseflow due to changes in irrigated land after 1997
Models (continued) • Analysis was done for six reaches • Wyoming line to Kingsley Dam • Kingsley Dam to Tri-County Supply Canal diversion • Tri-County Supply Canal diversion to Lexington • Lexington to U.S. Highway 183 • U.S. Highway 183 to Chapman • Chapman to Columbus
Models (continued) Reaches used in analysis A – Wyoming to Kingsley Dam (blue streams) B – Kingsley Dam to Tri-County Supply Canal (violet streams) C – Tri-County Supply Canal to Lexington (cyan streams) D – Lexington to U.S. Highway 183 (pink streams) E – U.S. Highway 183 to Chapman (blue streams) F – Chapman to Columbus (violet streams) Reaches used in analysis A F Streams are assigned to reach based on where they contribute to flow of Platte River B C D E
Results • Monthly results are reported in acre-feet per day • One acre-foot per day equals • 0.504 cubic feet per second • 226 gallons per minute • Cumulative results are presented in thousands of acre-feet • One thousand acre-feet equals 325,900,000 gallons
Results – Hwy. 183 to Chapman (E) Source of noise still being investigated
Results (continued) Annual results for year ending May 1 of indicated year Units are thousands of acre-feet per year
Results (continued) Cumulative results Units are thousands of acre-feet
Second Analysis • Hydrologically Connected Area for the Overappropriated Basin (HCA/OA) • Administrative determination by DNR • Based on 28% stream depletion in 40 years • Eastern Analysis Area (EAA) • Developed for comparative purposes • Based on 10% depletion in 50 years • Developed for Highway 183 to Chapman only • Effects of gained or lost irrigated land only in HCA/OA and EAA
HCA/OA and EAA EAA is “under construction” HCA/OA EAA
HCA/OA - EAA – Wyoming line to Kingsley Dam (A) HCA/OA – EAA only Everywhere
HCA/OA - EAA – Kingsley Dam to Tri-County Canal (B) HCA/OA – EAA only Everywhere
HCA/OA - EAA – Tri-County to Lexington (C) HCA/OA – EAA only Everywhere
HCA/OA - EAA – Lexington to Hwy. 183 (D) HCA/OA – EAA only Everywhere
HCA/OA - EAA – Hwy. 183 to Chapman (E) HCA/OA – EAA only Everywhere
HCA/OA - EAA – Chapman to Columbus (F) EAA is not defined below Chapman Everywhere
Results (continued) Annual results for year ending May 1 of indicated year Units are thousands of acre-feet per year
Results (continued) Cumulative results Units are thousands of acre-feet
Closing comments • Analysis very dependent on estimated gained or lost pumpage • Use of 1997-98 meteorological conditions for net irrigation requirement did not represent dry or wet cycles • Results more reliable in earlier time and less reliable in later time • Western model had some dry cells that probably had small effect on results • Effect still being analyzed • Results affected by evapotranspiration salvage, especially east of U.S. Highway 183