Download
1 / 43
430 likes | 549 Views
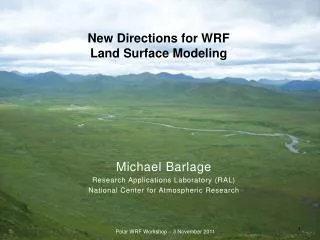
NEW DIRECTIONS IN LAND SURFACE MODELING. Sellers et al. (1997) list 3 generations of land surface models: 1. Simple (e.g., “bucket”) models (see previous lecture) 2. SVAT models (like Mosaic; see previous lecture) 3. Models handling carbon In this lecture, we will:

E N D
NEW DIRECTIONS IN LAND SURFACE MODELING Sellers et al. (1997) list 3 generations of land surface models: 1. Simple (e.g., “bucket”) models (see previous lecture) 2. SVAT models (like Mosaic; see previous lecture) 3. Models handling carbon In this lecture, we will: -- Take a brief look at generation #3. (Thanks to Jim Collatz for various carbon cycle figures.) -- Go over an analysis of evaporation and runoff formulations that suggests an alternative path of model evolution. -- Describe a new land surface model that follows this alternative path.
Why the interest in carbon? Clearly, for questions of global climate change. Why the interest in modeling the land’s role in the carbon cycle? Note, for example, the impact of land seasonality on the atmospheric CO2 content.
Land sources and sinks of carbon are net yet well quantified, as indicated by the famous “missing carbon sink”.
(Slightly dated) list of carbon modeling references, from a compilation by Jim Collatz:
“[Third generation models] use modern theories relating photosynthesis and plant water relations to provide a consistent description of energy exchange, evapotranspiration, and carbon exchange by plants…. The third-generation LSPs point the way to future land models that can be coupled with comprehensive atmospheric and ocean models to explore different global exchange scenarios.” -- Sellers et al. SiB2
Many different types of carbon assimilation models exist. In the particular comparison shown here, only SiB2 is a “SVAT-type” carbon model. All of these models, though, have the same goal: to understand the global distribution and temporal variations of the carbon cycle at the land surface. Annual net primary production (g C m -2 yr-1) estimated as the average of all model NPP estimates. IGBP/GAIM REPORT SERIES,REPORT #5, “NET PRIMARY PRODUCTIVITY MODEL INTERCOMPARISON ACTIVITY (NPP)”, Wolfgang Cramer and the participants* of the "Potsdam '95" NPP model intercomparison workshop
DYNAMIC VEGATION: Yet another step forward in model development Typical GCM approach: ignore effects of climate variations on vegetation Early attempts at accounting for vegetation/ climate consistency Fully integrated dynamic vegetation model Figure from Foley et al., “Coupling dynamic models of climate and vegetation”, Global Change Biology, 4, 561-579, 1998.
DYNAMIC VEGATION (cont.) Mappings between climate and vegetation exist that can be used for the second approach on the previous page. The third approach on the previous page requires a whole new type of model framework. Figure from Foley et al., “Coupling dynamic models of climate and vegetation”, Global Change Biology, 4, 561-579, 1998. Figure from Mather, The Climatic Water Budget in Environmental Analysis, Lexington Books.
(Analysis introducing a possible alternative path for LSM development) What underlies the behavior of a land surface model? PILPS (the Project for the Intercomparison of Landsurface Parameterization Schemes): a project in which the responses of various land surface models to the same atmospheric forcing are quantified and compared. Overall goal: a better understanding of land surface model (LSM) behavior. Typical PILPS result: wide disparity in LSM response. How do we explain this disparity? We can’t compare code or even compare descriptions of the parameterizations -- the LSMs are too complex, and such a comparison would soon become intractable. Alternative approach: empirically characterize underlying controls on evaporation and runoff. Reference: Koster, R. and P. C. D. Milly, The interplay between evaporation and runoff formulations in a land surface model, J. Climate, 10, 1578-1591, 1997.
Many of the models that performed the experiment on the previous page performed a supplemental experiment that imposed a great many controls: Prescribed vegetation type and fraction Prescribed albedo Prescribed aerodynamic resistance No seasonal variation in vegetation parameters No snowfall Model disparity remained high: In fact, model disparity is even higher than before -- apparently, in the control (on the previous page), differences in the above quantities led to compensating effects. The experiment to the left, though, simplifies the task of explaining differences in LSM behavior.
w(n+1) - w(n) Consider a simple water balance model: = P - Ei - Rs - Ew - Q Dt functions of w Rs P - Ei P (prescribed) Ei (prescribed) Ew (computed) Rs (computed) P - Ei w (root zone soil moisture) 1 25 1 Simple case: no baseflow bT Q bT Q (computed) R R E - Ei Ep - Ei 0 0 0 0 200 400 600 800 1000 0 200 400 600 800 1000 bT = 0 defines lower limit of soil moisture R = 1 defines upper limit of soil moisture (when no baseflow) Transpiration efficiency = bT = Runoff ratio = R = Baseflow = Q (mm/day)
How might these linear relationships look? For each model participating in the PILPS experiment, we can plot monthly average root zone soil moisture (w) against monthly average bT, R, and Q, for each of the 12 months. We can then fit, through simple regression, lines that characterize (to first order) the model’s inherently complex relationships between soil moisture and the fluxes. bT vs w for 3 LSMs R vs w for 3 LSMs Q vs w for 3 LSMs Fits certainly aren’t perfect, but they do describe the first order relationship.
Through these fits, we see that each LSM is characterized by different relationships between root zone moisture and the fluxes. dashed line: R heavy line: bT dotted line: Q
In the simple water balance model, take Rs = R(w) (P - Ei) Ew = bT(w) (Ep - Ei) G = G(w) When the fitted curves are used to define the coefficient of the Rs, Ew, and G functions, and when the simple water balance model is used with these values, the resulting transpiration fluxes agree very well with the fluxes the original models simulated. Key interpretation: the simple linear fits capture much of the intrinsic behavior of the different LSMs.
Note the the success of the simple water balance model (with coefficients from linear fits) extends beyond the annual scale -- it also applies to the models’ simulation of seasonal transpiration rates.
We can extend this analysis further by considering the annual mean of the water balance equation: P - Ei = Rs + Ew = R(w) (P - Ei) + bT(w) (Ep - Ei) The unique solution can be written: where D = ( Ep - Ei ) / ( P - Ei ) (a climatic “index of dryness”) bT = Average of beta function across soil moisture range fR = Fraction of soil moisture range over which runoff occurs. Assume for now that the drainage term can be “folded into” the runoff term. 2 D bT Ew = 1 + 2 D bT fR P - Ei 1 bT R wO wr w1 0 fR bT 1 = shaded area / (w1-w0) fR = (w1-wr)/(w1-w0)
Although the equation produces a biased evapotranspiration, it nevertheless explains (in large part) the variability amongst the models.
as described by bT and fR Thus, it is the relative positions of the runoff and evaporation functions that determine the annual transpiration rate -- not the average soil moisture. Most important take-home lesson: soil moisture in one model need not have the same “meaning” as that in another model. As long as the transpiration and runoff curves have the same relative positions, two models (e.g., Models A and B below) will behave identically, even if they have different soil moisture ranges. (True for simple models in simple water balance framework and for complex LSMs running in AGCMs.) Model A Model B 1 1 bT bT R R 0 0 0 200 400 600 800 1000 0 200 400 600 800 1000
Sure enough, the LSMs in PILPS have different soil moisture ranges... …and there is no evidence that LSMs with higher soil moistures produce higher evaporations.
Important aside: What does “model-produced soil moisture” mean? What are the implications of a misinterpreted soil moisture? Common problem: GCM “A” needs to initialize its land model with realistic soil moistures for some application (e.g., a forecast). Misguided, dangerous, and all too common solution: Use soil moistures generated by GCM “B” during a reanalysis or by land model “C” in an offline forcing exercise (e.g., GSWP), after correcting for differences in layer depths and possibly soil type. This solution is popular because of a misconception of what “soil moisture” means in a land model. Contrary to popular belief, -- model “soil moisture” is not a physical quantity that can be directly measured in the field. -- model “soil moisture” isbest thought of as a model- specific “index of wetness” that increases during wet periods and decreases during dry periods.
Should a land modeler be concerned that modeled soil moisture has a nebulous meaning – that it doesn’t match observations? It depends on one’s outlook.Consider that in the real world: (1) soil moisture varies tremendously across the distances represented by GCM grid cells, (2) surface fluxes (evaporation, runoff, etc.) vary nonlinearly with soil moisture. and dry evaporation efficiency wet wet hundreds of km soil moisture
Wet: s=1.0 Dry: s=0.5 Simple example based on the nonlinear response of the “beta function” (evaporation efficiency) to soil moisture. (Such nonlinearity has indeed been measured locally in the real world.) Consider a region split into a wet half (degree of saturation = 1) and a drier half (degree of saturation = 0.5). The average soil moisture is 0.75. Under the simplifying assumption that the potential evaporation is the same over both sides, we have: 0.6 Ewet = 0.6 Ep Edry = 0.4 Ep Eave = 0.5 Ep average soil moisture = 0.75 E based on average soil moisture = 0.55 Ep 0.55 evaporation efficiency 0.4 0.5 0.75 1.0 soil moisture
The example suggests that if a land modeler is forced to represent the soil with vertical layers, with a single variable representing the moisture in a tremendously large area, and without any representation of subgrid process variability, the following is the best that can be hoped for: Unrealistic soil moisture and Realistic areally-averaged surface fluxes Realistic soil moisture and Unrealistic areally-averaged surface fluxes or Arguably, for AGCM applications, a modeler would strive for this – given the restrictions of model resolution, the modeler may choose to live with a nebulous soil moisture variable.
Clearly, inserting a soil moisture from Model A into Model B is dangerous, even if the Model A product is a trusted reanalysis. Extreme, idealized example: A very wet condition for Model A is a very dry condition for Model B soil moisture range for Model B soil moisture range for Model A 200. 400. 0. “soil moisture in top meter of soil” (mm)
Approaches do exist for mapping one model’s soil moisture into that of another, for purposes of initialization. For example, we can scale using standard normal deviates: pdf of soil moisture: Model “B” pdf of soil moisture: Model “A” asB asA mA XA mB XB XA - mA XB - mB = sA sB These pdfs, of course, will vary with region. A caveat: for some applications, particularly those that employ a constantly evolving modeling system (e.g., data assimilation and forecasting), the decadal model output needed to generate the pdf descriptions will probably be unavailable.
Note on the meaning of Dsoil moisture / Dt While soil moisture has a nebulous meaning in land surface models, the time change in soil moisture should be well-defined – e.g., the monthly change of moisture below the land-atmosphere interface can be calculated with Monthly change = Monthly Precipitation – Monthly Evaporation – Monthly Runoff, and all terms on the R.H.S. of this equation have precise, unambiguous meanings. In practice, intermodel differences in “monthly soil moisture change” are much smaller than intermodel differences in absolute soil moisture (e.g., Entin et al., 1999). Still, -- some differences do exist, due to differences in the size of the soil moisture dynamic range, a function of model parameterization. -- in any case, the transformation of a Dsoil moisture / Dt value to a model initialization is not necessarily straightforward.
Now: Back to the discussion of evaporation, runoff, and soil moisture 1 In actuality (in nature and in most models), the bT function isn’t simply linear; the value of bT plateaus out at high soil moisture. (The linearity assumption was used mostly for convenience.) At high enough soil moisture, the plant is no longer water stressed, and increased soil moisture does not increase transpiration. Nevertheless, the same arguments apply: it is the relative positions of the runoff and evaporation functions that determine the annual transpiration rate. In many recent LSMs, the value of the non-water stressed bT is given considerable attention. It might, for example be effectively computed as a function of: Vegetation type, LAI, greenness Environmental stresses (e.g., temperature) CO2, photosynthesis Aerodynamic properties Other quantities bT R 0 0 200 400 600 800 1000 Relatively little attention has been given to the formulation of runoff -- a big mistake, if accurate annual evaporations are desired. 1 1 1 bT bT bT R R R 0 0 0 0 200 400 600 800 1000 0 200 400 600 800 1000 0 200 400 600 800 1000
These two examples (from an application with the simple water balance model) illustrate that even with the same bT function, different evaporation rates stem from different assigned runoff functions. Different runoff functions lead to different transpiration rates
Current state of LSMs Path 2 Path 1 Improved representation of subgrid variability (e.g., of soil moisture and its effects on runoff and evaporation) Focus on horizontal, 3-D representation Improved representation of point processes (canopy structure, soil levels, photosynthesis physics…) Focus on vertical, 1-D representation Again, relatively little attention has been given to runoff formulations, as compared to evaporation formulations. This suggests an alternative path of model evolution. This path is useful for improving runoff formulations. Why? Because the main reason for poor runoff formulations is the inability to treat subgrid variability accurately (see water balance lecture). Essentially the path outlined in the Sellers et al paper.
Recall from 3rd lecture: runoff cannot be represented realistically with a one- dimensional vertical framework. In a typical LSM, the soil moisture is effectively assumed uniform in layers a few centimeters thick spanning hundreds of kilometers! Scale: hundreds of kilometers
An example of a land surface model that follows this second path: the “NSIPP catchment LSM”. Approach: 1. Use the hydrological catchment as the fundamental land surface unit. Don’t assume land surface element has a shape defined by the overlying atmospheric grid 2. Within each catchment, use hydrological models for dealing with subgrid-scale soil moisture distributions. TOPMODEL, with a special treatment of the unsaturated zone. (We employ many of the ideas introduced by Famiglietti and Wood, 1994.) References: Koster et al., J.Geophys. Res.,105, 24809-24822, 2000. Ducharne et al., J. Geophys. Res.,105, 24823-24838, 2000.
Basic idea behind catchment model: Different moisture levels (shown here as different water table depths)… …lead to different areal partitionings of the catchment into saturated, unstressed, and wilting regimes.
Based on the values of these two prognostic variables (and a third [MSD], analogous to MRZ but related to the moisture close to the surface) we can explicitly resolve three hydrological regimes: the saturated zone the unsaturated but unstressed zone the wilting zone Different physics applies in each zone. Unlike one-dimensional, “vertical column” LSMs, we can explicitly apply these different physics. Evaporation Saturated area: allow unstressed transpiration, unstressed bare soil evaporation. Unsaturated area: allow unstressed transpiration, stressed bare soil evaporation. Wilting zone: Zero transpiration, allow stressed bare soil evaporation. Runoff Saturated area: All rainfall becomes surface runoff. Unsaturated area: Infiltration allowed. Wilting zone: Infiltration allowed. Baseflow Computed based on water table distribution (TOPMODEL) Wilting zone Unsaturated zone Saturated zone
A similar (though non-spatially integrated) calculation is performed to determine the flux of moisture between the thin surface reservoir and the root zone.
Topographic Data Requirements 1. Catchment delineations (global) 2. Statistics of topographic index within each catchment: -- mean -- standard deviation -- skew 3. Scaling approaches: what would the statistics look like if we had higher resolution data? These data are not used directly in the model; rather, they are transformed into a number of model parameters. Figure courtesy of Colin Stark, LDEO, Columbia University
Model parameters are derived from basic topographic statistics. In essence, the model parameters are empirical fits to very complicated calculations.
The catchment model has been tested in various venues, including the PILPS 2c Red-Arkansas test.
Unstressed fraction Unstressed fraction Stressed fraction Stressed fraction
New formulations for “stormflow” and for the effects of variable depth to bedrock. The NSIPP Catchment LSM is continually undergoing… …development …validation depth to bedrock is typically smaller at hilltop… overland flow stormflow …than at valley bottom baseflow
The model described above represents just one possible way of treating explicitly the subgrid variation of soil moisture in a land surface grid cell and its impact on evaporation and (especially) runoff. Other ways certainly exist, e.g., VIC: The point is, the importance of modeling this subgrid variability must not get lost in our zeal to improve the one-dimensional physics in a land surface model. Take-home lesson: more than one “evolutionary path” is needed.