Download
1 / 28
280 likes | 422 Views
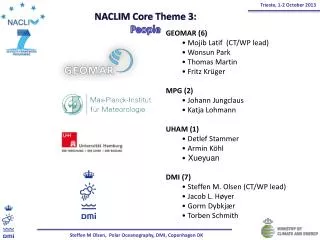
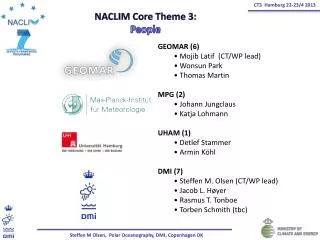
CT3 Barcelona 6-8/10 2012. NACLIM Core Theme 3: People. GEOMAR (6) Mojib Latif (CT/WP lead) Wonsun Park Thomas Martin MPG (2) Johann Jungclaus ( tbc ) Katja Lohmann ( tbc ) UHAM (1) Detlef Stammer Armin Köhl DMI (7) Steffen M. Olsen (CT/WP lead) Jacob L. Høyer

E N D
CT3 Barcelona 6-8/10 2012 NACLIM Core Theme 3: People • GEOMAR (6) • MojibLatif (CT/WP lead) • Wonsun Park • Thomas Martin • MPG (2) • Johann Jungclaus (tbc) • KatjaLohmann (tbc) • UHAM (1) • Detlef Stammer • Armin Köhl • DMI (7) • Steffen M. Olsen (CT/WP lead) • Jacob L. Høyer • Rasmus T. Tonboe • TorbenSchmith Steffen M Olsen, Polar Oceanography, DMI, Copenhagen DK
CT3 Barcelona 6-8/10 2012 NACLIM Core Theme 3: Structure Initialization of prediction systems with ocean observations WP 3.2 Steffen M. Olsen WP 3.1 MojibLatif Suitability of the ocean observing system components for initialization Impact of Arctic initialization on forecast skill Steffen M Olsen, Polar Oceanography, DMI, Copenhagen DK
CT3 Barcelona 6-8/10 2012 NACLIM Core Theme 3: WP 3.1 • Objectives • Investigate and quantify the benefit of different components of the ocean observing system for prediction systems (decadal) • Identify necessary enhancements and potential reductions in the present system WP 3.1 Suitability of the ocean observing system components for initialization • Methodology • Ideal model World hindcast experiments using the adjoint assimilation system of UHAM - an environment for climate model initialization • Re-start simulations with truncated ocean initial conditions corresponding to different ocean regions and observing systems Steffen M Olsen, Polar Oceanography, DMI, Copenhagen DK
CT3 Barcelona 6-8/10 2012 NACLIM Core Theme 3: WP 3.1 Deliverables D9 (GEOMAR, month 12): Report on the setup of coupled model and hindcasts conducted with initial conditions corresponding to ARGO-like sampling D 26 (GEOMAR, month 24): Report on hindcasts conducted with initial conditions extended to include ”RAPID”, and on the feasibility of decadal forecasts with the current ocean observing system D 39 (GEOMAR, month 36): Report on hindcasts conducted with satellite information D 58 (GEOMAR, month 44): Report on the identifications of potential needs that are not captured by the present ocean observing system for enhancing decadal predictions. Steffen M Olsen, Polar Oceanography, DMI, Copenhagen DK
CT3 Barcelona 6-8/10 2012 NACLIM Core Theme 3: WP 3.2 • Objectives • Establish the impact of Arctic data and ini-tialization of the Arctic region on forecast skill • Construct a 15 year combined SST/IST dataset for the Arctic Ocean • Explore the potential to constrain the state of the Arctic Ocean by remote observations – flux monitoring system at the GSR. WP 3.2 Impact of Arctic initialization on forecast skill • Methodology • This WP address in detail the Arctic region of sparse data coverage. • Work is organized along three parallel tracks including • - ideal model experiments (data withholding, potential predictability) • - improving data availability and • - explore the use of remote transport measurements. Steffen M Olsen, Polar Oceanography, DMI, Copenhagen DK
CT3 Barcelona 6-8/10 2012 NACLIM Core Theme 3: WP 3.2 Deliverables D10 (DMI, month 12): Assessment of model build-up, storage and release of Arctic Ocean freshwater pools. D27 (UHAM, month 24): Report on the documentation and description of improved model parameters. D28 (DMI, month 24): Report on the documentation and description of the new Arctic Ocean dataset combining SST and IST. D40 (DMI, month 36): Report on the establishment of impact of the Arctic region initialization, and on the sources of predictive skill from data withholding experiments. D51 (DMI, month 44): Assessment of the value of the GSR flux monitoring time series for confining the initial state of the upper Arctic Ocean. Steffen M Olsen, Polar Oceanography, DMI, Copenhagen DK
CT3 Barcelona 6-8/10 2012 NACLIM Core Theme 3: WP 3.2 Combined satellite SST and IST for the Arctic Ocean • DMI is experienced with SST and Ice Surface Temperature data processing through Eumetsat (OSI-SAF), ESA (CCI) and EU (MyOcean) projects. • Arctic SST reanalysis product (1985-present) will be available from end of the year (within other project) • 15 years combined SST and Ice Surface Temperature data record will be developed within NACLIM, based upon AVHRR observations. • Both Level 3 (with gaps) and level 4 (gap-free) fields will be produced. • Special attention will be on error characterization and uncertainties • Objective: to demonstrate the impact of improved data on the forecast skills. Steffen M Olsen, Polar Oceanography, DMI, Copenhagen DK
CT3 Barcelona 6-8/10 2012 NACLIM Core Theme 3: WP 3.2 Combined satellite SST and IST for the Arctic Ocean Level 3 example of Ice, Sea and Marginal Ice Zone – Surface Temperatures from METOP AVHRR References: Tonboe, R. T., Dybkjær, G. and Høyer, J. L.Simulations of the snowcoveredseaicesurfacetemperature and microwaveeffectivetemperature, Tellus , 63A, 1028–1037, 2011 Høyer, J. L., IoannaKaragali, Gorm Dybkjær, Rasmus Tonboe, Multi sensor validation and errorcharacteristics of Arcticsatelliteseasurfacetemperature observations, RemoteSensing of Environment, Volume 121, June 2012, Pages 335-346, ISSN 0034-4257, 10.1016/j.rse.2012.01.013. Dybkjær, G., Høyer, J., Tonboe, R., 2012. Arcticsurfacetemperatures from Metop AVHRR compared to in situ ocean and land data. In press, Ocean Sci., 9, doi:10.5194/osd-9-1009-2012, 2012. Steffen M Olsen, Polar Oceanography, DMI, Copenhagen DK
CT3 Barcelona 6-8/10 2012 NACLIM Core Theme 3: WP 3.2 Combined satellite SST and IST for the Arctic Ocean Long term satellite datasets with uncertainties for model validation and assimilation: ice surface temperature and ice concentration Steffen M Olsen, Polar Oceanography, DMI, Copenhagen DK
CT3 Barcelona 6-8/10 2012 NACLIM Core Theme 3: Open questions Verify the list if people and expected level of involvement Explore overlapping synergies with CT1 Decide on the level of internal coordination and WP specific meetings in addition to the annual meetings - joint activities with CT1 on overarching themes may be more constructive scientifically. Steffen M Olsen, Polar Oceanography, DMI, Copenhagen DK
Barcelona 6-8/10 2012 End Steffen M Olsen, Polar Oceanography, DMI, Copenhagen DK
Barcelona 6-8/10 2012 Forced response to GIS mass loss Outline - with contributions from Thor CT2 scientists • Model experiment • Large scale ocean response to enhanced GIS mass loss • present and future sensitivity • Impact on the Arctic and ocean freshwater anomalies • Conclusions • - Strong anthropogenic warming (RCP8.5) result in a decoupling of the abyss and reduced impact of hosing. • - Ventilation in the Arctic Ocean may contribute a new source of dense water production aiding to maintain an ongoing overturning. • - Using the FWC as a diagnostic aid, that theArctic Ocean response to hosing is partly masked by internal ocean variability and dominated by global warming effects. Steffen M Olsen, Polar Oceanography, DMI, Copenhagen DK
Barcelona 6-8/10 2012 Forced response to GIS mass loss EC-Earth Experimental setup Two parallel model experiments forced with 0.1 Sv additional runoff Runoff is distributed equally around Greenland in twoperiods 1965-2005 (Historical) 2050-2090 (RCP8.5) RCP8.5 forcing used over the period 2006-2100 In Thor CT2, five models contributed: EC-Earth, MPI-ESM, HadCM3, IPSLCM5A-LR and BCM (Swingedouw et al. in prep). Steffen M Olsen, Polar Oceanography, DMI, Copenhagen DK
Barcelona 6-8/10 2012 Forced response to GIS mass loss EC-Earth RCP8.5 AMOC 26N 36N 60N 45N Steffen M Olsen, Polar Oceanography, DMI, Copenhagen DK
Barcelona 6-8/10 2012 Forced response to GIS mass loss RCP8.5 vshistocical AMOC – decade 4 1965 2050 Changes are confined to the main thermocline in the 2050/RCP8.5 experiment Steffen M Olsen, Polar Oceanography, DMI, Copenhagen DK
Barcelona 6-8/10 2012 Forced response to GIS mass loss RCP8.5 vs historical 1965 2050 MLD – decade 4 <- Control -> <- Hosing-> Steffen M Olsen, Polar Oceanography, DMI, Copenhagen DK
Barcelona 6-8/10 2012 Forced response to GIS mass loss RCP8.5 vs Historical Annual maximum mixed layer depth 2050 1965 Steffen M Olsen, Polar Oceanography, DMI, Copenhagen DK
Barcelona 6-8/10 2012 Forced response to GIS mass loss RCP8.5 vs Historical 0-800m mean temperature 2050 1965 Steffen M Olsen, Polar Oceanography, DMI, Copenhagen DK
Barcelona 6-8/10 2012 Forced response to GIS mass loss RCP8.5 vs Historical 0-800m mean salinity 2050 1965 Steffen M Olsen, Polar Oceanography, DMI, Copenhagen DK
Barcelona 6-8/10 2012 Forced response to GIS mass loss FW content - preindustrial Preindustrial de Steur et al. 2012 (in prep) Steffen M Olsen, Polar Oceanography, DMI, Copenhagen DK
Barcelona 6-8/10 2012 Forced response to GIS mass loss Historical to RCP8.5 Freshwater content relative to S=34.8 ArcticOcean+BaffinSubpolar North AtlanticGIN Seas 8000 km3 Historical RCP8.5 Steffen M Olsen, Polar Oceanography, DMI, Copenhagen DK
Barcelona 6-8/10 2012 Forced response to GIS mass loss Preindustrial control climate Steffen M Olsen, Polar Oceanography, DMI, Copenhagen DK
Barcelona 6-8/10 2012 Forced response to GIS mass loss Preindustrial control climate FWC (103 km3) The Arctic FW reservoir appears weakly constrained Distributions may suggest two modes? - no significant atmospheric mode identified Steffen M Olsen, Polar Oceanography, DMI, Copenhagen DK
Barcelona 6-8/10 2012 Forced response to GIS mass loss Preindustrial control climate Difference in SLP between high and low anomalies in FWC changes No relation – no concern ! • Changes in FWC are driven by multi annual variations in AO • Results are consistent with the concept of a simple white noise integration - AO defining the noise • If so, the autocorrelation of the FWC is practically unlimited and predictable • but this was not what we wanted to establish… Steffen M Olsen, Polar Oceanography, DMI, Copenhagen DK
Barcelona 6-8/10 2012 Forced response to GIS mass loss End Steffen M Olsen, Polar Oceanography, DMI, Copenhagen DK
Barcelona 6-8/10 2012 Forced response to GIS mass loss FWC anomaly Steffen M Olsen, Polar Oceanography, DMI, Copenhagen DK
Barcelona 6-8/10 2012 Forced response to GIS mass loss AO (Morison et al. 2012) Steffen M Olsen, Polar Oceanography, DMI, Copenhagen DK
Barcelona 6-8/10 2012 Forced response to GIS mass loss Historical climate conditions MOC (Sv) Heat transport (PW) Outflow/Inflow (-) Steffen M Olsen, Polar Oceanography, DMI, Copenhagen DK