Download
1 / 52
570 likes | 855 Views
Simulation of Traffic Systems. Simulation. Popular and effective tool for analyzing a wide variety of dynamic and complex problems which are not amenable to study by other means.

E N D
Simulation • Popular and effective tool for analyzing a wide variety of dynamic and complex problems which are not amenable to study by other means. • Usually these dynamic and complex processes are characterized by interaction of many system components or entities. • Often, the behaviour of each entity and the interaction of a limited number of entities, can be reliably represented logically and mathematically • However, the complex, simultaneous interaction of many system components cannot be adequately described in mathematical of logical form.
Simulation • Simulation models are design (using mathematical/ logical representations) to “mimic” the behaviour of such systems • Properly design model integrate these separate entity behaviour and interaction to produced a detailed, quantitative description of system performance. • Dynamic representation of some part of real world achieved by building a computer model and moving it through time (Drew, 1968).
Requirement of Simulation • Evaluation of alternative treatments • Testing new designs • As an element of design process • Training personnel • Safety analysis
Modeling approaches • Continuous or Discrete simulation • In continuous simulation element of system changes state continuously over time in response to continuous stimuli while in discrete simulation systems change their states abruptly at point in time. Generally of two types: • Time stepped: the model calculates the changes in the system for finite steps (e.g. 1 second) • event based: the model calculates changes in the system when something ’happens’ (events) • Stochastic or Deterministic: • stochastic modelling captures variation in e.g. reaction time, arrival processes, route choice. But every simulation run results in different outcome, so you need to replicate simulation runs
Modeling approaches • Microscopic (high fidelity) • Describes both the system entities and their interactions at high level of details • Individual vehicles with detailed behaviour • Example: a lane change maneuver could invoke car-following law for subject vehicle w.r.t. its LV then w.r.t. its putative LV and its putative FV in target lane, as well as representing other detailed driver decision process. • Mesoscopic (mixed fidelity) • Represents most entities at a high level of detail but describes their activities and interactions at much lower level of detail than would a microscopic model • Individual vehicles with aggregate behaviour • Example: lane change maneuver could be represented for individual vehicles as an instantaneous event with the decision based, say, on relative lane densities, rather than detailed vehicle interactions. • Macroscopic (low fidelity) • Describes entities and their activities and interactions at a low level of detail • Example: traffic stream is represented in some aggregate manner like flow, density, speed. Lane change maneuver is not be represented • Like water flowing through a pipe
Modeling approaches • Static • Models average steady-state traffic situation (EMME/2) • Dynamic • Models change over time of the traffic simulation Static Dynamic time
Building Traffic Simulation Models • Define the Problem and the Model Objectives • State the purpose for which the model is being developed • Define the information that the model must provide • Define the System to be Studied • Disaggregate the system to identify its major components • Define the major interactions of these components • Identify the information needed as inputs. • Bound the domain of the system to be modeled.
Building Traffic Simulation Models • Develop the Model • Identify the level of complexity needed to satisfy the stated objectives • Classify the model and define its inputs and outputs • Define the flow of data within the model • Define the functions and processes of the model components • Determine the calibration requirements and form: scalars, statistical distributions, parametric dependencies. software is replicating a model component properly as designed, • Develop abstractions (i.e., mathematical-logical statistical algorithms) of each major system component, their activities and interactions. • Create a logical structure for integrating these model components to support the flow of data among them. • Select the software development paradigm, programming language(s), user interface,presentation formats of model results. • Design the software: simulation, structured or object-oriented programming language; database, relational/object oriented. • Document the logic and all computational procedures • Develop software code and debug
Building Traffic Simulation Models • Calibrate the Model • Collect/acquire data to calibrate the model. • Introduce this data into the model • Model Verification • Establish that the software executes in accord with the design specification. • Perform verification at the model component level • Model Validation • Collect, reduce, organize data for purposes of validation. • Establish that the model describes the real system at an acceptable level of accuracy over its entire domain of operation; apply rigorous statistical testing methods • Documentation • Executive Summary • Users Manual • Model documentation: algorithms and software
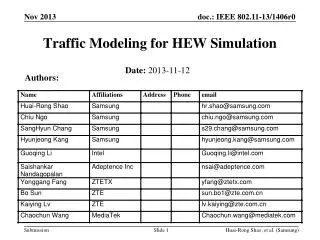
Introduction • VISSIM is a microscopic multi-modal traffic flow simulation software developed in 1992. • Developed by in Karlsruhe, Germany.
VISSIM: Microscopic Simulation Tool VISSIM is a microscopic, time-step based, behavioral traffic flow simulation model. The model contains a psycho-physical car following model for longitudinal vehicle movement and a rule-based algorithm for lateral movements. VISSIM uses Weidemann’s psycho-physical car following model.
Model of Traffic Simulation in VISSIM • Weidemann: The basic idea of the Wiedemann model is the assumption that a driver can be in one of four driving modes. • Free driving • Approaching • Following • Braking
Live Demo of VISSIM 6.0 By Nama Suresh M Tech, Transportation Systems Engineering
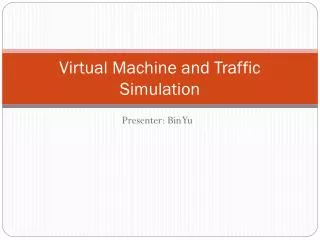
GUI – Graphical User Interface GUI – Graphical User Interface
GUI – Graphical User Interface • Network object type button • Lock button • Button with the name of network object type • Selecting variants of a network object type. • Static. • Dynamic. • Partial. • Parking lot. • Icon for graphical parameters • Label icon
Lesson 2 • Graphical User Interface – GUI • Background Files • Links & Connectors • Speeds, Traffic Compositions and Volumes • Vehicle Routing Decisions • Reduced Speed Areas & Desired Speed Decisions • Priority Rules & Conflict Areas • Signal Control • Transit Stops & Bus / Tram Lines • Evaluation & Results
Begin Model Development – Background File • Multiple backgrounds can be inserted • BMP, JPG, GIF, PNG,TGA etc., formats are accepted
Lesson 3 • Graphical User Interface – GUI • Background Files • Links & Connectors • Speeds, Traffic Compositions and Volumes • Vehicle Routing Decisions • Reduced Speed Areas & Desired Speed Decisions • Priority Rules & Conflict Areas • Signal Control • Transit Stops & Bus / Tram Lines • Evaluation & Results
Adding in Lane and Links DRAG Start from here by clicking right mouse button
Adding in Lane and Links Press “Ctrl”+A to toggle between normal and center line view
Lesson 4 • Graphical User Interface – GUI • Background Files • Links & Connectors • Speeds, Traffic Compositions and Volumes • Vehicle Routing Decisions • Reduced Speed Areas & Desired Speed Decisions • Priority Rules & Conflict Areas • Signal Control • Transit Stops & Bus / Tram Lines • Evaluation & Results
Right-click to insert a point on the curve, then drag and drop Speed Distribution
Vehicle Compositions Right click ADD Right click ADD
Lesson 5 • Graphical User Interface – GUI • Background Files • Links & Connectors • Speeds, Traffic Compositions and Volumes • Vehicle Routing Decisions • Reduced Speed Areas & Desired Speed Decisions • Priority Rules & Conflict Areas • Signal Control • Transit Stops & Bus / Tram Lines • Evaluation & Results
Vehicle Routing Decisions Right click Left click
Lesson 6 • Graphical User Interface – GUI • Background Files • Links & Connectors • Speeds, Traffic Compositions and Volumes • Vehicle Routing Decisions • Reduced Speed Areas & Desired Speed Decisions • Priority Rules & Conflict Areas • Signal Control • Transit Stops & Bus / Tram Lines • Evaluation & Results
Lesson 7 • Graphical User Interface – GUI • Background Files • Links & Connectors • Speeds, Traffic Compositions and Volumes • Vehicle Routing Decisions • Reduced Speed Areas & Desired Speed Decisions • Priority Rules & Conflict Areas • Signal Control • Transit Stops & Bus / Tram Lines • Evaluation & Results
Lesson 8 • Graphical User Interface – GUI • Background Files • Links & Connectors • Speeds, Traffic Compositions and Volumes • Vehicle Routing Decisions • Reduced Speed Areas & Desired Speed Decisions • Priority Rules & Conflict Areas • Signal Control • Transit Stops & Bus / Tram Lines • Evaluation & Results
Lesson 9 • Graphical User Interface – GUI • Background Files • Links & Connectors • Speeds, Traffic Compositions and Volumes • Vehicle Routing Decisions • Reduced Speed Areas & Desired Speed Decisions • Priority Rules & Conflict Areas • Signal Control • Transit Stops & Bus / Tram Lines • Evaluation & Results
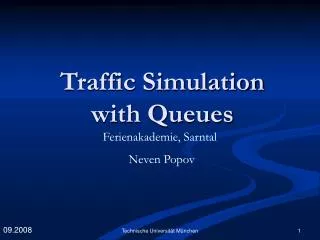
Select link with bus stop Select Transit Stops Transit Stops Open Junction12.inp Create a bus stop Press Ctrl+A to view centreline Input a bus/tram line Right click and drag from start point to end of bus stop
Select a link and right click to place starting marker Select a link and right click to place ending marker Select Bus/Tram Lines Bus / Tram Lines Save network as Junction13.inp
Lesson 10 • Graphical User Interface – GUI • Background Files • Links & Connectors • Speeds, Traffic Compositions and Volumes • Vehicle Routing Decisions • Reduced Speed Areas & Desired Speed Decisions • Priority Rules & Conflict Areas • Signal Control • Transit Stops & Bus / Tram Lines • Evaluation & Results
EVALUATION & RESULTS Queue counters are added Data collection points are added