Download
1 / 10
100 likes | 153 Views
Figure 8: Output From The Baseline Model. A) Distribution of War Character Gene (Gene #1=1 shown in black). B) Distribution of War shown by black lines connecting nodes. C) Distribution of Trade shown by green lines connecting nodes.

E N D
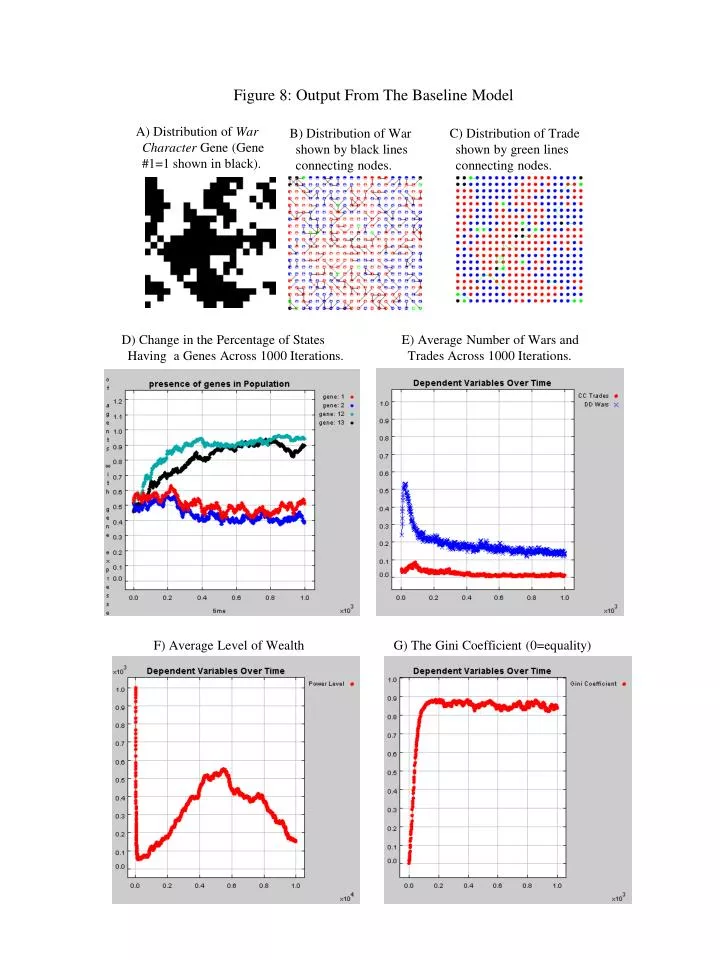
Figure 8: Output From The Baseline Model A) Distribution of War Character Gene (Gene #1=1 shown in black). B) Distribution of War shown by black lines connecting nodes. C) Distribution of Trade shown by green lines connecting nodes. D) Change in the Percentage of States Having a Genes Across 1000 Iterations. E) Average Number of Wars and Trades Across 1000 Iterations. F) Average Level of Wealth G) The Gini Coefficient (0=equality)
Figure 10: H1: Increasing the Gains From Trade A) Distribution of War Character Gene (Gene #1=1 shown in black). B) Distribution of War shown by black lines connecting nodes. C) Distribution of Trade shown by green lines connecting nodes. D) Change in the Percentage of States Having a Genes Across 1000 Iterations. E) Average Number of Wars and Trades Across 1000 Iterations. F) Spatial Distribution of Wealth (Blue above 1000 and Red Below 1000 Power Unites)
Figure 11: H2: Offense Dominance A) Distribution of War Character Gene (Gene #1=1 shown in black). B) Distribution of War shown by black lines connecting nodes. C) Distribution of Trade shown by green lines connecting nodes. D) Change in the Percentage of States Having a Genes Across 1000 Iterations. E) Average Number of Wars and Trades Across 1000 Iterations. F) Spatial Distribution of Wealth (Blue above 1000 and Red Below 1000 Power Unites)
Figure 12: H3: Permitting Trade with Non-Neighbors A) Distribution of War Character Gene (Gene #1=1 shown in black). B) Distribution of War shown by black lines connecting nodes. C) Distribution of Trade shown by green lines connecting nodes. D) Change in the Percentage of States Having a Genes Across 1000 Iterations. E) Average Number of Wars and Trades Across 1000 Iterations. F) Spatial Distribution of Wealth (Blue above 1000 and Red Below 1000 Power Unites)
Figure 13: Altering the Exit Payoffs 0.10 Exit Payoffs Baseline Model 0.90 Exit Payoffs Gene #1: 1=black, 0=white Wars: Line Connections Trades: Line Connections Gene Prevalence Over Time Trade, War and Inequality Across Time Power Level Relative to Start
Figure 14: Absolute versus Relative Payoffs Absolute Payoffs Relative Payoffs Gene #1: 1=black, 0=white Wars: Line Connections Trades: Line Connections Gene Prevalence Over Time Trade, War and Inequality Across Time Power Level Relative to Start
Figure 15: Rapid Learning Representative Runs A) Distribution of War Character Gene (Gene #1=1 shown in black). B) Distribution of War shown by black lines connecting nodes. C) Distribution of Trade shown by green lines connecting nodes. D) Change in the Percentage of States Having a Genes Across 1000 Iterations. E) Average Number of Wars and Trades Across 1000 Iterations. F) Spatial Distribution of Wealth (Blue above 1000 and Red Below 1000 Power Unites)
Figure 16: Simultaneously Raise Trade Benefits and War Costs A) Distribution of War Character Gene (Gene #1=1 shown in black). B) Distribution of War shown by black lines connecting nodes. C) Distribution of Trade shown by green lines connecting nodes. D) Change in the Percentage of States Having a Genes Across 1300 Iterations. E) Average Number of Wars and Trades Across 1300 Iterations. F) Spatial Distribution of Wealth (Blue above 1000 and Red Below 1000 Power Unites)
Figure 17: Simultaneously Raise Trade Benefits and Permitting Non-Neighbor Trade A) Distribution of War Character Gene (Gene #1=1 shown in black). B) Distribution of War shown by black lines connecting nodes. C) Distribution of Trade shown by green lines connecting nodes. D) Change in the Percentage of States Having a Genes Across 1300 Iterations. E) Average Number of Wars and Trades Across 1300 Iterations. F) Spatial Distribution of Wealth (Blue above 1000 and Red Below 1000 Power Unites)
Figure 18: Simultaneously Allow Rapid Learning, Increased Trade Benefits, Increased War Costs, and Non-Neighbor Trade A) Distribution of War Character Gene (Gene #1=1 shown in black). B) Distribution of War shown by black lines connecting nodes. C) Distribution of Trade shown by green lines connecting nodes. D) Change in the Percentage of States Having a Genes Across 1300 Iterations. E) Average Number of Wars and Trades Across 1300 Iterations. F) Spatial Distribution of Wealth (Blue above 1000 and Red Below 1000 Power Unites)