Download
1 / 74
800 likes | 1.07k Views
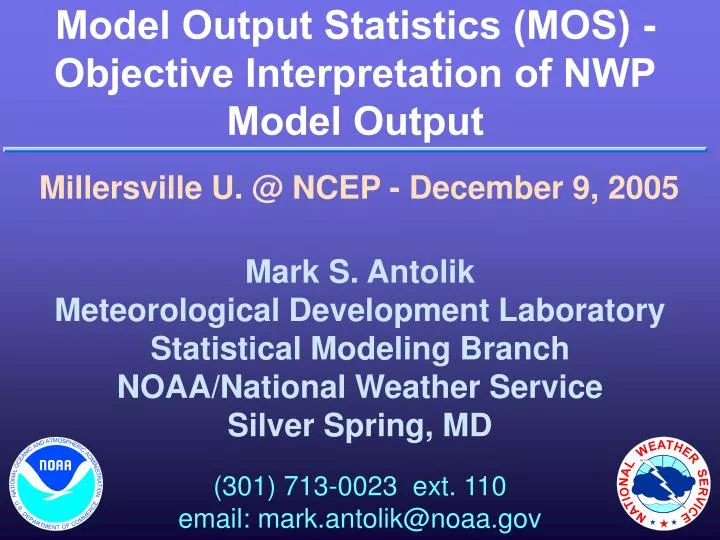
Model Output Statistics (MOS) - Objective Interpretation of NWP Model Output. Millersville U. @ NCEP - December 9, 2005. Mark S. Antolik Meteorological Development Laboratory Statistical Modeling Branch NOAA/National Weather Service Silver Spring, MD. (301) 713-0023 ext. 110

E N D
Model Output Statistics (MOS) - Objective Interpretation of NWPModel Output Millersville U. @ NCEP - December 9, 2005 Mark S. Antolik Meteorological Development Laboratory Statistical Modeling Branch NOAA/National Weather Service Silver Spring, MD (301) 713-0023 ext. 110 email: mark.antolik@noaa.gov
OUTLINE 1. Why objective statistical guidance? 2. What is MOS? Definition and characteristics The “traditional” MOS product suite (NGM, eta, GFS) Recent additions to the lineup 3. Simple regression examples / Probability 4. Development strategy - MOS in the “real world” 5. Verification 6. Where we’re going - The future of MOS
WHY STATISTICAL GUIDANCE? • Add value to direct NWP model output • Objectively interpret model • - remove systematic biases • - quantify uncertainty • Predict what the model does not • Produce site-specific forecasts • (i.e. a “downscaling” technique) • Assist forecasters • “First Guess” for expected local conditions • “Built-in” model/climo memory for new staff
A SIMPLE STATISTICAL MODEL Relative Frequency of Precipitation as a Function of12-24 Hour NGM Model-Forecast Mean RH 1.0 0.9 3-YR SAMPLE; 200 STATIONS 0.8 1987-1990 COOL SEASON 0.7 0.6 47% OBSERVED REL. FREQUENCY 0.5 0.4 0.3 0.2 0.1 0.0 0 10 20 30 40 50 60 70 80 90 100 NGM MEAN RELATIVE HUMIDITY (%)
MODEL OUTPUT STATISTICS (MOS) Relates observed weather elements (PREDICTANDS) to appropriate variables (PREDICTORS) via a statistical approach. Predictors are obtained from: • Numerical Weather Prediction (NWP) Model • Forecasts • 2. Prior Surface Weather Observations • 3. Geoclimatic Information • Current Statistical Method: • MULTIPLE LINEAR REGRESSION • (Forward Selection)
MODEL OUTPUT STATISTICS (MOS) Properties • Mathematically simple, yet powerful • Need historical record of observations at forecast points (Hopefully a long, stable one!) • Equations are applied to future run of similar forecast model
MODEL OUTPUT STATISTICS (MOS) Properties (cont.) • Non-linearity can be modeled by using NWP variables and transformations • Probability forecasts possible from a single run of NWP model • Other statistical methods can be used • e.g. Polynomial or logistic regression; • Neural networks
MODEL OUTPUT STATISTICS (MOS) • ADVANTAGES • Recognition of model predictability • Removal of some systematic model bias • Optimal predictor selection • Reliable probabilities • Specific element and site forecasts • DISADVANTAGES • Short samples • Changing NWP models • Availability & quality of obs
GFS MOS GUIDANCE MESSAGEFOUS21-26 (MAV) KLNS GFS MOS GUIDANCE 11/29/2004 1200 UTC DT /NOV 29/NOV 30 /DEC 1 /DEC 2 HR 18 21 00 03 06 09 12 15 18 21 00 03 06 09 12 15 18 21 00 06 12 N/X 28 48 35 49 33 TMP 43 44 39 36 33 32 31 39 46 45 41 38 37 39 41 44 45 44 40 40 35 DPT 27 27 28 29 29 29 29 33 35 35 36 35 36 39 41 42 37 34 30 30 28 CLD CL BK BK BK OV OV OV OV OV OV OV OV OV OV OV OV OV BK CL CL CL WDR 34 36 00 00 00 00 00 00 00 14 12 12 10 11 12 19 28 29 29 29 28 WSP 06 02 00 00 00 00 00 00 00 01 02 04 04 06 07 08 15 17 18 09 05 P06 0 0 4 3 11 65 94 96 7 0 0 P12 6 19 94 96 0 Q06 0 0 0 0 0 3 4 4 0 0 0 Q12 0 0 4 2 0 T06 0/ 0 0/18 0/ 3 0/ 0 0/ 0 0/18 2/ 1 10/ 4 0/ 3 1/ 0 T12 0/26 0/17 0/27 10/25 1/38 POZ 2 0 0 1 2 4 4 0 1 1 2 3 3 1 1 0 2 1 2 3 1 POS 13 2 1 2 1 0 0 0 0 0 0 0 0 2 0 0 0 3 0 9 28 TYP R R R R R R R R R R R R R R R R R R R R R SNW 0 0 0 CIG 8 8 8 8 7 7 7 8 8 7 7 7 4 2 3 3 6 7 8 8 8 VIS 7 7 7 7 7 7 7 7 7 7 7 7 5 5 4 2 6 7 7 7 7 OBV N N N N N N N N N N N N BR BR BR BR N N N N N
Eta MOS GUIDANCE MESSAGEFOUS44-49 (MET) KTHV ETA MOS GUIDANCE 11/28/2005 1200 UTC DT /NOV 28/NOV 29 /NOV 30 /DEC 1 HR 18 21 00 03 06 09 12 15 18 21 00 03 06 09 12 15 18 21 00 06 12 N/X 60 65 52 54 28 TMP 58 60 58 61 65 66 66 60 62 61 62 61 59 57 54 52 53 50 41 35 32 DPT 50 52 52 54 57 58 58 55 58 59 57 56 54 52 49 43 39 36 34 29 27 CLD OV OV OV OV OV OV OV OV OV OV OV OV OV OV OV OV OV SC CL SC BK WDR 15 13 12 14 16 15 13 17 16 15 15 16 18 24 29 29 31 32 30 27 32 WSP 05 07 07 10 12 12 10 10 10 09 08 08 07 07 05 10 09 06 03 01 03 P06 14 62 87 94 91 90 71 21 6 6 0 P12 88 100 93 28 7 Q06 0 1 2 3 4 4 2 0 0 0 0 Q12 1 4 4 0 0 T06 2/ 0 7/ 0 8/ 4 13/ 2 25/ 3 28/ 2 21/ 2 9/ 1 3/ 3999/99 T12 7/ 0 22/ 4 41/ 4 24/ 3 999/99 SNW 0 0 0 CIG 3 5 3 3 2 2 2 3 5 4 3 3 3 4 5 6 6 8 8 8 8 VIS 5 6 6 5 5 3 3 3 5 5 4 2 3 3 7 7 7 7 7 7 7 OBV BR N BR BR BR BR BR BR HZ BR BR BR BR BR N N N N N N N
GFS / Eta MOS vs. NGM MOS • MORE STATIONS: • Now at approx. 1650 Forecast Sites • (CONUS, HI, PR) • MORE FORECASTS: • Available at projections of 12- 84 hours • GFS available for 0600 and 1800 UTC cycles • BETTER RESOLUTION: • GFS predictors on 95.25 km grid; Eta on 32 km • Predictor fields available at 3-h timesteps • Predictors available beyond 48-h projection • * No extrapolative forecasts • DEPENDENT SAMPLE NOT “IDEAL”: • Fewer Seasons • Non-static underlying NWP model
GFS / Eta MOS vs. NGM MOS • MORE STATIONS: • Now at approx. 1650 Forecast Sites • (CONUS, AK, HI, PR) • MORE FORECASTS: • Available at projections of 12- 84 hours • GFS available for 0600 and 1800 UTC cycles • BETTER RESOLUTION: • GFS predictors on 95.25 km grid; Eta on 32 km • Predictor fields available at 3-h timesteps • Predictors available beyond 48-h projection • * No extrapolative forecasts • DEPENDENT SAMPLE NOT “IDEAL”: • Fewer Seasons • Non-static underlying NWP model
GFSX MOS GUIDANCE MESSAGEFEUS21-26 (MEX) KCXY GFSX MOS GUIDANCE 11/26/2004 0000 UTC FHR 24| 36 48| 60 72| 84 96|108 120|132 144|156 168|180 192 FRI 26| SAT 27| SUN 28| MON 29| TUE 30| WED 01| THU 02| FRI 03 CLIMO X/N 43| 29 47| 40 55| 35 51| 29 45| 32 40| 36 42| 30 45 31 46 TMP 37| 32 43| 43 46| 37 41| 32 39| 35 36| 38 37| 33 37 DPT 24| 27 37| 40 32| 28 28| 26 31| 32 30| 32 27| 24 25 CLD PC| OV OV| OV PC| CL PC| PC OV| OV OV| PC CL| CL CL WND 10| 5 11| 11 16| 10 10| 5 9| 6 10| 12 14| 12 12 P12 0| 5 13| 91 13| 3 9| 14 24| 52 54| 48 21| 12 25 20 18 P24 | 16| 100| 9| 26| 62| 72| 25 29 Q12 0| 0 0| 3 0| 0 0| 0 0| 2 2| 2 | Q24 | 0| 3| 0| 0| 4| | T12 0| 0 0| 3 0| 0 0| 0 4| 6 4| 3 1| 1 1 T24 | 0 | 3 | 0 | 0 | 6 | 4 | 1 PZP 12| 9 12| 4 3| 5 6| 10 8| 8 3| 16 10| 12 8 PSN 62| 15 3| 0 0| 10 9| 15 24| 1 0| 9 32| 27 18 PRS 26| 24 7| 0 17| 18 20| 13 15| 1 2| 18 9| 11 11 TYP S| RS R| R R| R R| R RS| R R| R RS| RS R SNW | 0| 0| 0| 0| | |
Marine MOS 44004 GFS MOS GUIDANCE 11/22/2005 1200 UTC DT /NOV 22/NOV 23 /NOV 24 /NOV 25 HR 18 21 00 03 06 09 12 15 18 21 00 03 06 09 12 15 18 21 00 03 06 TMP 58 53 49 49 50 48 46 44 44 45 47 48 51 54 56 60 62 61 59 51 47 WD 23 25 27 28 28 29 29 28 28 27 27 25 22 22 22 23 23 23 24 27 28 WS 33 31 29 25 23 22 24 25 23 18 14 12 14 19 26 29 30 29 29 28 24 WS10 36 34 31 26 25 24 26 27 25 19 15 13 15 21 28 31 32 31 31 30 26 DT /NOV 25 / HR 09 12 15 18 21 00 TMP 45 45 45 47 47 47 WD 29 29 28 30 29 34 WS 18 15 10 10 13 12 WS10 20 16 11 11 14 13 Marine MOS sites Standard MOS sites
MOS Snowfall Guidance Uses Observations from Cooperative Observer Network >Trace - 2 2 - < 4 4 - < 6 6 - <8 Verification 36-hr forecast 12Z 12/05/03 – 12Z 12/06/03
Max/Min Guidance for Co-op Sites GFS-BASED MOS COOP MAX/MIN GUIDANCE 12/01/04 1200 UTC THU 02| FRI 03| SAT 04 GYLP1 30 41| 29 41| 28 46 HAWP1 28 42| 24 39| 20 38 HBGP1 34 47| 28 45| 27 43 HRBP1 35 45| 29 44| 29 43 INDP1 28 44| 27 44| 28 46 JMSP1 26 39| 24 40| 28 42 KANP1 24 34| 22 33| 22 36 LAPP1 27 37| 25 35| 22 36 LBGP1 33 45| 28 42| 25 42 LCRP1 33 46| 27 46| 27 46 LDVP1 29 49| 25 45| 23 42 LEBP1 30 46| 26 43| 24 45 LHGP1 30 45| 24 44| 25 41 LMPP1 26 36| 25 37| 26 41 LNVP1 28 38| 27 38| 27 41 LOKP1 32 43| 27 43| 27 41 LRLP1 29 47| 24 43| 23 40 LSTP1 34 46| 29 45| 29 42 MATP1 29 45| 24 42| 22 38 MCKP1 27 40| 27 41| 26 45 MERP1 22 40| 22 41| 24 43 Lancaster 2 NE Landisville, PA
Western Pacific MOS Guidance Midway, US Wake, US Saipan, ROM NSTU GFS MOS GUIDANCE 12/05/2005 1200 UTC DT /DEC 5/DEC 6 /DEC 7 /DEC 8 HR 18 21 00 03 06 09 12 15 18 21 00 03 06 09 12 15 18 21 00 06 12 WDR 12 11 11 11 09 09 10 11 09 09 08 11 09 04 32 00 00 05 06 03 30 WSP 07 08 09 10 09 06 04 03 04 07 08 05 05 02 01 00 00 05 06 03 01
Very recent additions New within the past year… • GFSX MOS: New 1200 UTC package (no clds, wind, ptype) • Eta MOS: • Visibility and obstruction to vision forecasts • Marine MOS: Temperature forecasts • Western Pacific MOS wind guidance
MOS LINEAR REGRESSION JANUARY 1 - JANUARY 30, 1994 0000 UTCKCMH 60 50 40 30 TODAY'S MAX (°F) 20 10 0 -10 1150 1200 1250 1300 1350 18-H NGM 850-1000 MB THICKNESS (M)
MOS LINEAR REGRESSION JANUARY 1 - JANUARY 30, 1994 0000 UTCKCMH 60 MAX T = -352 + (0.3 x 850-1000 mb THK) 50 40 RV=93.1% 30 TODAY'S MAX (°F) 20 10 0 -10 1150 1200 1250 1300 1350 18-H NGM 850-1000 MB THICKNESS (M)
REDUCTION OF VARIANCE A measure of the “goodness” of fit andPredictor / Predictand correlation Variance - Standard Error RV = Variance MEAN PREDICTAND { RV } UNEXPLAINED VARIANCE * PREDICTOR
MOS LINEAR REGRESSION JANUARY 1 - JANUARY 30, 1994 0000 UTCKUIL 60 50 TODAY'S MAX (°F) 40 RV=26.8% 30 1250 1300 1350 1400 18-H NGM 850-1000 MB THICKNESS (M)
MOS LINEAR REGRESSION DECEMBER 1 1993 - MARCH 5 1994 0000 UTCKCMH 1 12-24 H PRECIPITATION ≥ .01" 0 10 20 30 40 50 60 70 80 90 100 AVG. 12-24 H NGM ~1000 - 500 MB RH
MOS LINEAR REGRESSION DECEMBER 1 1993 - MARCH 5 1994 0000 UTCKCMH 1 RV=36.5% 12-24 H PRECIPITATION ≥ .01" 0 10 20 30 40 50 60 70 80 90 100 AVG. 12-24 H NGM ~1000 - 500 MB RH
MOS LINEAR REGRESSION DECEMBER 1 1993 - MARCH 5 1994 0000 UTCKCMH 1 RV=36.5% 12-24 H PRECIPITATION ≥ .01" RV=42.4% 0 10 20 30 40 50 60 70 80 90 100 AVG. 12-24 H NGM ~1000 - 500 MB RH
MOS LINEAR REGRESSION DECEMBER 1 1993 - MARCH 5 1994 0000 UTCKCMH 1 RV=44.9% RV=36.5% 12-24 H PRECIPITATION ≥ .01" RV=42.4% 0 POP = -0.234 + (0.007 X MRH) + (0.478 X BINARY MRH (70%)) 10 20 30 40 50 60 70 80 90 100 AVG. 12-24 H NGM ~1000 - 500 MB RH
EXAMPLE REGRESSION EQUATIONS Y = a + bX CMH MAX TEMPERATURE EQUATION MAX T = -352 + (0.3 x 850 -1000 mb THICKNESS) CMH PROBABILITY OF PRECIPITATION EQUATION POP = -0.234 + (0.007 x MEAN RH) + (0.478 x BINARY MEAN RH CUTOFF AT 70%)* *(IF MRH ≥ 70% BINARY MRH = 1; else BINARY MRH = 0)
If the predictand is BINARY, MOS regression equations produceestimates of event PROBABILITIES... KCMH 1 3 Events P = 30% RF= 30% 12-24 H PRECIPITATION ≥ .01" 0 7 Events 10 20 30 40 50 60 70 80 90 100 AVG. 12-24 H NGM ~1000 - 500 MB RH
Making a PROBABILISTIC statement... Quantifies the uncertainty !
DEFINITION of PROBABILITY (Wilks, 1994) • LONG TERM RELATIVE FREQUENCY OF AN EVENT • DEGREE OF BELIEF OR QUANTIFIED JUDGMENT ABOUT THE OCCURRENCE OF AN UNCERTAIN EVENT KEEP IN MIND: Assessment of probability is EXTREMELYdependent upon how predictand “event” is defined: - Time period of consideration - Area of occurrence - Dependent upon another event? • POINT PROBABILITY • AREAL PROBABILITY • CONDITIONAL PROBABILITY
40-km gridbox 10% contour interval 20-km gridbox 10% contour interval AREAL PROBABILITIES 3H Eta MOS thunderstorm probability forecasts valid 0000 UTC 8/27/2002 (21-24h proj) What if these were 6-h forecasts?
Designing an Operational MOS System: Putting theory into practice…
DEVELOPMENTAL CONSIDERATIONS MOS in the real world • Selection (and QC!) of Suitable Observational Datasets ASOS? Remote sensor? Which mesonet?
Suitable observations? Appropriate Sensor? Real or Memorex? Good siting? Photo Courtesy W. Shaffer
DEVELOPMENTAL CONSIDERATIONS MOS in the real world • Selection (and QC!) of Suitable Observational Datasets ASOS? Remote sensor? Which mesonet? • Predictand Definition • Must be precise !!
PREDICTAND DEFINITION Max/Min and PoP Daytime Maximum Temperature “Daytime” is 0700 AM - 0700 PM LST Nighttime Minimum Temperature “Nighttime” is 0700 PM - 0800 AM LST Probability of Precipitation Precipitation occurrence is accumulation of ≥ 0.01 inches of liquid-equivalent at a gauge location within a specified period
DEVELOPMENTAL CONSIDERATIONS MOS in the real world • Selection (and QC!) of Suitable Observational Datasets ASOS? Remote sensor? Which mesonet? • Predictand Definition • Must be precise !! • Choice of Predictors • “Appropriate” formulation • Binary or other transform?
“APPROPRIATE” PREDICTORS X • RECIPITABLE WATER VERTICAL VELOCITY MOISTURE DIVERGENCE MODEL PRECIPITATION 1000-500 MB THK TROPOPAUSE HGT • DESCRIBE PHYSICAL PROCESSES ASSOCIATED WITH OCCURRENCE OF PREDICTAND • “MIMIC” FORECASTER THOUGHT PROCESS i.e. for POP: (VERTICAL VELOCITY) X (MEAN RH)
DEVELOPMENTAL CONSIDERATIONS (cont.) • Terms in Equations; Selection Criteria
“REAL” REGRESSION EQUATIONS MULTIVARIATE MOS regression equations are , of form: Y = a + a X + a X + ... + a X 0 1 1 2 2 N N Where, the "a's" represent COEFFICIENTS the "X's" represent PREDICTORvariables QUITE The maximum number of terms, N, can be large: For NGM QPF, N = 15 For NGM VIS, N = 20 The FORWARD SELECTION procedure determines the predictors and the order in which they appear.
DEVELOPMENTAL CONSIDERATIONS (cont.) • Terms in Equations; Selection Criteria • Dependent Data • Sample Size, Stability, Representativeness • AVOID OVERFIT !! • Stratification - Seasons • Pooling – Regions
MOS LINEAR REGRESSION OCTOBER 1 1993 - MARCH 31 1994 0000 UTCKUIL 1 RV=14.2% 12-24 H PRECIPITATION ≥ 1.0" 0 0 0.00 0.25 0.50 0.75 1.00 12-24 H NGM PRECIPITATION AMOUNT (IN.)
AVN/GFS Cool Season PoP/QPF Regions With AVN MOS forecast sites (1406)