Download
1 / 31
310 likes | 589 Views
From Randomness to Probability. Chapter 14. Where Have We Been and Where are We Going?. Know how to summarize data with graphs, statistics, and verbal descriptions – i.e. Descriptive Statistics Still need to discuss data collection methods

E N D
From Randomness to Probability Chapter 14
Where Have We Been and Where are We Going? • Know how to summarize data with graphs, statistics, and verbal descriptions – i.e. Descriptive Statistics • Still need to discuss data collection methods • Understand that results will vary from sample to sample (or experiment to experiment) • Sometimes we are surprised by the degree of variation. May require an update to our model of the world. • Just how unusual are these results? To answer this question we must know something about probability • Probability is the bridge between Descriptive Statistics and Inferential Statistics
POP Quiz!!! You likely cross paths with probabilities on a daily basis, but how much do you really know? 1.) Which of the following is more likely to be a Powerball winner? A.) 32 11 5 24 18 3 B.) 1 2 3 4 5 6 2.) Here are the results of 9 coin flips: THTHHHHHH What is the most likely outcome for the 10th coin? 3.) Why is a royal flush the highest hand in poker? (10, Jack, Queen, King and Ace, all of the same suit)
Today’s Objectives • Learn probability terms, define probability • Learn some basic rules of probability • Apply basic probability rules to find probabilities of more complex events • Discuss the Law of Large Numbers
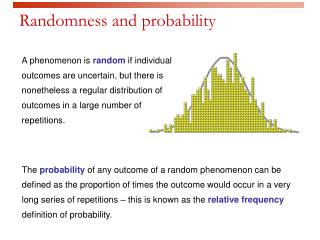
Randomness and Probability An event is random if individual outcomes are uncertain but there is a regular distribution of outcomes in a large number of repetitions. The probability of any outcome of a random event is the proportion of times the outcome would occur in a very long series of repetitions. The probability that an event A will occur is written as P(A) and is read “the probability of A”. Three Different Types of Probability: 1. Theoretical 2. Empirical 3. Subjective
Interpreting Probability A probability can be interpreted in two ways: 1.) As a short-term chance - % chance that the outcome is going to happen on the next try 2.) As the percent of times that an event will happen in the long run (over a long period of time with repeated trials under the same conditions).
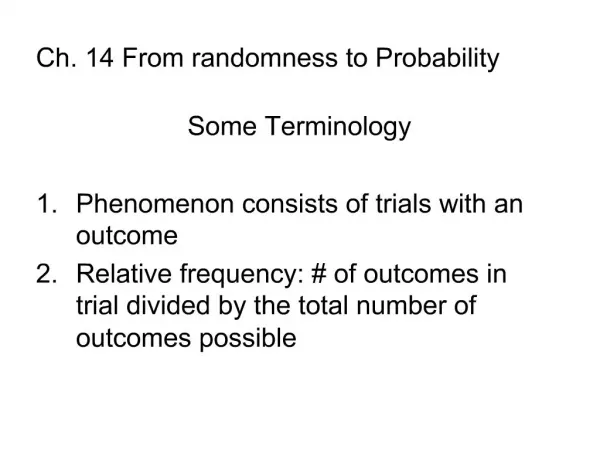
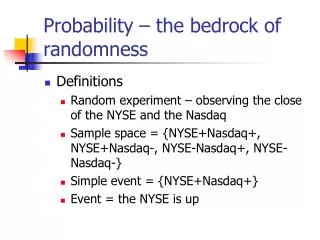
Vocabulary of Probability Theory Experiment - anything that produces an outcome Examples: flipping a coin, rolling a die Outcome - a particular result of an experiment Examples: coin lands on heads, die lands on 5 Sample space - set of all possible outcomes of an experiment Examples: S = {Heads, Tails} S= {1,2,3,4,5,6} Event - an outcome or a set of outcomes that are of interest to the experimenter.
Probability Rules for Equally Likely Events In a S where outcomes are equally likely, then the probability of event A, P(A) is P(A) = Number of ways that A can occur Total # of possible outcomes Approach is called Classical Theoretical Probability
A Simple Experiment Suppose we were to roll a die: What is the sample space? S = {1, 2, 3, 4, 5, 6} Event A = die lands on 3, P(A) = 1/6 Event B = die lands on an even number, P(B) = 3/6 = 1/2
Another Simple Experiment • Selecting a card from a deck of cards • Event A = the Queen of Hearts is selected, P(A) = 1/52 • Event B = a Queen is selected, P(B) = 4/52 = 1/13 • Event C = a Heart is selected, P(C) = 13/52 • Event D = a face card is selected, P(D) = 12/52 = 3/13
Rules about Probabilities that Must Hold True • 0 <= P(A) <= 1, the probability of an event must be a number between 0 and 1, inclusive • P(S) = 1, the sum of the probabilities for the entire sample space must be equal to 1 - something must happen! • If an event must happen, P(A) = 1 • If an event is impossible, P(A) = 0
Complement Rule • The complement, AC, of an event A consists of exactly the outcomes that are not in A. • P(A) + P(AC) = 1 • P(A) = 1 - P(AC) • Example: Rolling a die, event A = the number face up is greater than 2. AC = all numbers that are not larger than 2. • P(AC) = 2/6 • P(A) = 1 - P(AC) = 1 - 2/6 = 4/6
Empirical Probabilities An empirical probability is one that is calculated from sample data and is an estimate for the true probability. Collect sample data and calculate relative frequencies. Find the exact probability that an item taken from the sample will have some characteristic of interest. If the data are a good representation of the population, then you can use the relative frequencies as estimates of the true probabilities for the population.
Example of Empirical Probabilities Frequency distribution of annual income for U.S. families:
Example of Empirical Probabilities Continued Find the probability that a U.S. family selected at random has an income under $10,000 Probability = 5,216/69,597 = 0.075
Example of Empirical Probabilities Continued Find the probability that a U.S. family selected at random has an income between $35,000 and $49,999. Probability = 12,841/69,597 = 0.186
Subjective Probabilities • The probability of the event, is found by simply guessing or estimating its value based on knowledge of the relevant circumstances. • Example: Will it rain tomorrow?, meteorologists use their expert knowledge and weather models to develop estimates of the probability.
Compound Events • Combining of two or more events from the experiment. • P ( this or that) Key word is or • P ( this and that) Key word is and
P (A or B) • Key word is or Use Addition Rule • Assumption: Events A and B are mutually exclusive • For two mutually exclusive events A and B, the probability that one or the other occurs is the sum of the probabilities of the two events. • P(A or B) = P(A) + P(B)
Using the Addition Rule Probability Model of marital status for women aged 25 to 34 years What is the probability that a woman drawn at random is either “never married” or “divorced”? P (never married or divorced) = P (never married) + P (divorced) = 0.298 + 0.075 = 0.373 That is, 37.3% of women between the ages of 25 and 34 are either never married or divorced.
Using the Addition Rule Probability Model of marital status for women aged 25 to 34 years What is the probability that a randomly selected woman is not married. Using the complement rule: P(not married) = 1 - P(married) = 1 – 0.622 = 0.378 If 62.2% of women are married, then the remaining 37.8 % are not married.
Another Example of the Addition Rule Suppose that 40 % of cars registered on campus are manufactured in the United States, 30 % in Japan, 10 % in Germany, and 20% in other countries. Find the probability that a randomly selected car was manufactured in Japan or Germany. P (Japan or Germany) = P(Japan) + P(Germany) = 0.30 + 0.10 = 0.40
P ( A and B) • Key word is and Use the Multiplication Rule • Assumption: Events A and B are independent • For two independent events A and B, the probability that both A and B occur is the product of the probabilities of the two events • P(A and B) = P(A) * P(B)
Example of Multiplication Rule Suppose that 40 % of cars registered on campus are manufactured in the United States, 30 % in Japan, 10 % in Germany, and 20% in other countries. Find the probability that if we randomly selected two cars the first was manufactured in the US and the second in Japan. P(1st from US and 2nd from Japan) = P(US) * P(Japan) = 0.4 * 0.3 = 0.12
The Probability of “At Least One” • Find the probability that among several trials, at least one will result in some specified outcome. • “At least one” is equivalent to “one or more” • The complement of getting at least one item of a particular type is that you get no items of that type. • Use the multiplication rule and the rule of complements to simplify this type of problem. • P (At least one) = 1 - P(none occur)
For a sales promotion, the manufacturer places winning symbols under the caps of 10 percent of all Pepsi bottles. You buy a six-pack. What is the probability that you win something? Example: “At Least One” Rule
Putting the Rules Together:Slot Machine • A slot machine has three wheels that spin independently. Each has 10 equally likely symbols: 4 bars, 3 lemons, 2 cherries, and a bell. If you play, what is the probability • You get 3 bells (the jackpot!!!) • You get no fruit symbols • You get at least one bar (an automatic loser ) • You get 2 lemons and 1 cherry • You get no bells
What Can Go Wrong? • Beware of probabilities that don’t add up to 1. • Don’t add probabilities of events if they are not mutually exclusive. • Don’t multiply probabilities of events if they are not independent. • Don’t confuse mutually exclusive and independent.
Law of Large Numbers (LLN) • The long-run relative frequency of repeated independent events gets closer and closer to the true relative frequency as the number of trials increases. • Example – an infinite number of coin flips should produce heads 50% of the time. • If probabilities remain the same and the events are independent, the probability of the next trial is always the same, no matter what has happened up to then.
What can go wrong? Bureaucrat’s Math Makes Dizzy Dozen The menu at Coffee Garden at 900 East and 900 South in Salt Lake City has included a scrumptious selection of quiche for about 10 years. The recipe calls for four fresh eggs for each quiche. A salt Lake County Health Department inspector paid a visit recently and pointed out that research by the Food and Drug Administration indicates that one in four eggs carries Salmonella bacterium, so restaurants should never use more than three eggs when preparing quiche. The manager on duty wondered if simply throwing out three eggs from each dozen and using the remaining nine in four-egg-quiches would serve the same purpose.
Assignment • Read Chapter 15: Probability Rules • Try the following exercises from Ch. 14. • #1, 5, 7, 9, 11, 13, 15, 23, 25, 29, 31, and 33 • Data Analysis Assignment #2 is now available and will be due in class on March 8th.