Download
1 / 21
210 likes | 268 Views
Improved Method for Estimating Vehicle Lengths under Congested Traffic. OTEC 2014. By Qingyi Ai ARCADIS US INC., Cleveland OH Oct 2014. M. M. S. S. Dual-loop detector on freeway. Introduction. D ual-loop detector

E N D
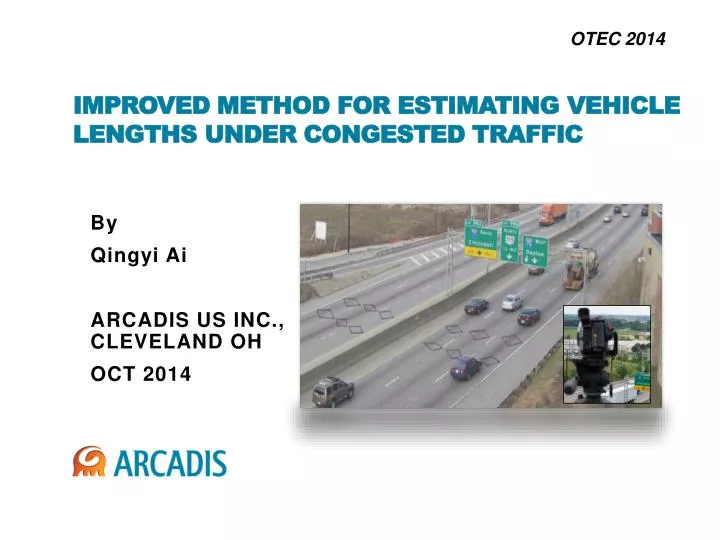
Improved Method for Estimating Vehicle Lengths under Congested Traffic OTEC 2014 By Qingyi Ai ARCADIS US INC., Cleveland OH Oct 2014
M M S S Dual-loop detector on freeway Introduction • Dual-loop detector • An inductive-loop station is usually made up of several parts: wire loops, lead-in wires, lead-in cables, a pull box, and a controller • When a vehicle enters or leaves the loop, the electronics unit will send a pulse to the controller. This pulse is recorded and indicates that a vehicle is detected • Information obtained from dual-loop detectors includes timestamp, vehicle count and occupancy. Based on this information, vehicle speed and vehicle length can be calculated. Traffic Flow
Introduction • Dual-loop detector data is widely used as a data source for vehicle classification because dual-loop detectors are reliable and less costly. • Length-based vehicle classification plays a very important role in many transportation areas • Traffic operation and management • Transportation planning • Traffic related air quality analysis
Distance between two single loops Dual-loop station M M S S t1 t3 t4 t2 time Introduction • The Existing Vehicle Classification model • Assumption: The difference between on times for both loops is very small. Where, D = distance between two single loops in the dual-loop station (ft); t = t3 - t1; and OnT1 = t2 - t1; and OnT2 = t4 - t3.
Introduction • Under non-free flow, the difference between on times on two loops is often large. The existing dual-loop length-based vehicle classification model produces many errors under congested traffic conditions, especially under stop-and-go traffic flow. • The errors arecontributed by the complex characteristics of traffic flows under congestion; but quantification of such contributing factors remains unclear. • The algorithm of screening dual-loop detector data may remove those data points which actually are good. • An updated model isneeded.
Methodology • Vehicle trajectory data extracted from video acts as the ground-truth data • Use the concurrent event dual-loop data to evaluate vehicle classification models against the ground-truth data • GPS data is employed to reveal traffic characteristics of different traffic states • Develop improved vehicle classification models integrating traffic-related factors
Camera Location Dual-loop detectors Data Collection • Study site: I-70/71 Downtown Columbus, OH • Dual-loop stations work properly • Recurrent traffic congestion Study Site
Data Collection • Study site: Williams Ave & I-71 Cincinnati, OH Study Site Study Site
Data Collection • Video Data Used as Ground-truth Data • 26 hours video data for 3 days at the study sites in Columbus; 8 hours video data for 2 days at the study site in Cincinnati. • Concurrent event dual-loop data obtained from the TMC at ODOT. • GPS data is collected using a probe car equipped with a GPS data logger
Data Extraction • Trajectory Data Extraction in VEVID • Software VEVID (Vehicle Video-Capture Data Collector) developed by Dr. Heng Wei, University of Cincinnati • Using VEVID to extract vehicle speeds, timestamps, and lengths.
Existing Model Evaluation • Evaluating Existing Vehicle Classification Model • Against ground-truth under free flow traffic • T-test is employed and the output from the existing model under free flow traffic is acceptable.
Existing Model Evaluation • Evaluating Existing Vehicle Classification Model • Under congested traffic, the existing model produced many errors, especially for large vehicles. • Updated or new models are needed to estimate vehicle lengths under congested traffic conditions.
M S M S Scenario 5 Scenario 1 M S M S Scenario 6 Scenario 2 M S M S Scenario 7 Scenario 3 M S M S Scenario 8 Scenario 4 Vehicles operating status • Vehicles Possible Operating Status over the Detection Area under Congested Traffic • Assumptions: 8 scenarios
Vehicles operating status • Statistical Analysis of Operating Status
Congested Traffic yes Scenario 1 OnT1<ts1, and OnT2<ts1 OnT1>ts1, and OnT2<ts1 OnT1<ts1, and OnT2>ts1 OnT1>ts1, OnT2>ts1, t3-t1<ts2, and t4-t2<ts2 Scenario 2 Scenario 3 Scenario 4 Note: 1. ts1 is the threshold of OnT1 and OnT2, and ts2 is the threshold of timestamp differences; t1, t2, t3, t4, OnT1, and OnT2 are the same as defined previously. 2. In this study, ts1 and ts2 are determined as 4.1s and 3.0s, respectively. Identifying Operating status • Under congested traffic, the following algorithm is proposed to identify a vehicle’s operating status. Flowchart for Identifying Vehicle Operating Status
New Vehicle Classification Model • When a vehicle is identified to fall into Scenario 1, 2, or 3: • Assumptions: constant acceleration or deceleration over the detection area Where, Lv= length of the detected vehicle (ft); Ls =length of each single loop within the dual-loop (ft); vo= speed of the vehicle entering the upstream loop (M loop) (ft/s); a = vehicle acceleration (ft/s2); and D, t, OnT1, and OnT2 are the same as defined earlier.
New Vehicle Classification Model • When a vehicle is identified to fall into Scenario 4: Where, Lv=length of vehicle (ft); Ls = length of each single loop within the dual-loop (ft); tdec= time period from a vehicle entering the M loop to its stop (s); tacc= time period from a vehicle starting to move to leaving the M loop (s); a = the average acceleration rate of vehicles when they start to move under stop-and-go traffic (ft/s2); ts = time period for a vehicle stopping on both loops (s); vmin= the minimum speed which can maintain a vehicle running without stop (ft/s); f1, f2, and f3 = adjusting factors for different vehicle types (in this study, f1= f2= f3=1); D, t, t2, t3, OnT1, and OnT2 = as the same as defined previously.
Output of new Model • The new vehicle length estimation model vs. the existing model (Scenario 1, 2, and 3) Error: Existing model: 33.5% New model: 6.7%
Output of new Model • The new vehicle length estimation model vs. the existing model (Scenario 4) Error: Existing model: 235% Newmodel: 17.1%
Acknowledgement • My advisor Dr. Heng Wei’s instructions during my study at University of Cincinnati • The study is supported by an Ohio Transportation Consortium (OTC) grant • Dr. Ben Coifman at the Ohio State University provided the event dual-loop data • Dr. Zhixia Li, Mr. Zhuo Yao, and other fellows in the ART Engine Lab provide great help in VEVID update and data collection
Thank you! Questions?