Download
1 / 12
120 likes | 228 Views
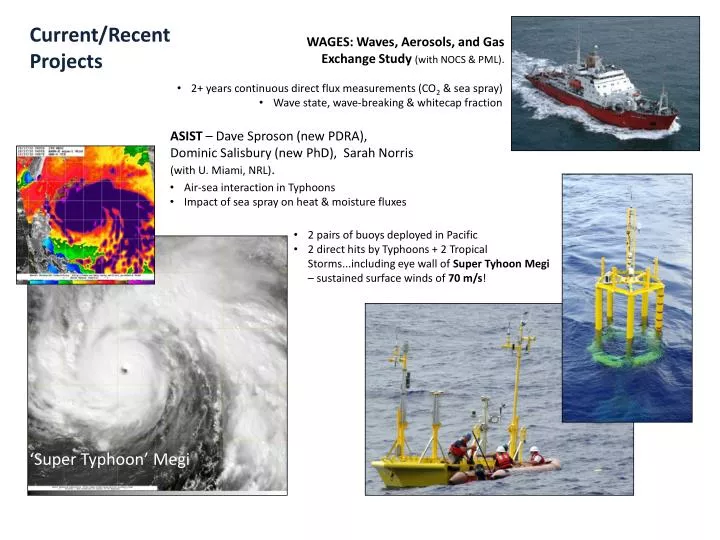
Current/Recent Projects. WAGES: Waves, Aerosols, and Gas Exchange Study (with NOCS & PML). 2+ years continuous direct flux measurements (CO 2 & sea spray) Wave state, wave-breaking & whitecap fraction.

E N D
Current/RecentProjects WAGES: Waves, Aerosols, and Gas Exchange Study(with NOCS & PML). • 2+ years continuous direct flux measurements (CO2 & sea spray) • Wave state, wave-breaking & whitecap fraction ASIST – Dave Sproson (new PDRA), Dominic Salisbury (new PhD), Sarah Norris (with U. Miami, NRL). • Air-sea interaction in Typhoons • Impact of sea spray on heat & moisture fluxes • 2 pairs of buoys deployed in Pacific • 2 direct hits by Typhoons + 2 Tropical Storms...including eye wall of Super Tyhoon Megi – sustained surface winds of 70 m/s! ‘Super Typhoon’ Megi
CLASP aerosol spectrometer ~0.25µm < D < 9.25µm Up to 32 channels (software selectable, usually run with 16) Up to 50Hz sampling (usually run at 10Hz) Sample flow = 50cm3 s-1 (actively measured and controlled)
High Wind Air-Sea Exchanges: HiWASE (M. J. Yelland) A NERC funded project for UK-SOLAS (Surface Ocean Lower Atmosphere Study). • Long term (September 2006 to December 2009) continuous air-sea flux measurements. • Direct measurements of momentum, sensible heat, latent heat and CO2 flux. • Comprehensive sea state measurements from 1) a ship-borne wave recorder and 2) a wave radar. • Whitecap fraction from cameras. • Max. 10 minute U10N 26 m/s, maxHs 11 m Brooks, Yelland, et al… (2009) Physical exchanges at the air-sea interface: UK-SOLAS Field Measurements. BAMS. http://www.noc.soton.ac.uk/ooc/CRUISES/HiWASE/OBS/data_intro.php
HiWASE results - gas transfer. • Gas transfer velocity data to nearly 20 m/s. • New parametersiation k=0.51+0.034 U3 implies significant bubble-mediated transport… • …as does the lower k relationship found for DMS. • Data are too noisy to see a sea-state signal directly. Huebert, B., B. Blomquist, M.X. Yang, S. Archer, P. Nightingale, M. J. Yelland, R. W. Pascal, B. I. Moat, 2010: Linearity of DMS Transfer Coefficient with Both Friction Velocity and Wind Speed in the Moderate Wind Speed Range. Geophysical Research Letters, 37, L01605, doi:10.1029/2009GL041203 PrytherchJ., M. J. Yelland, R. W. Pascal, B. I. Moat, I. Skjelvan and M. A. Srokosz, 2010b: The open ocean gas transfer velocity derived from long-term direct measurements of the CO2 flux.Geophysical Research Letters, accepted PrytherchJ., M. J. Yelland, R. W. Pascal, B. I. Moat, I. Skjelvan and C. C. Neill, 2010a: Direct measurements of the CO2 flux over the ocean: development of a novel method. Geophysical Research Letters, 37, 3, doi:10.1029/2009GL041482
HiWASE results - whitecap coverage. • Whitecap relationship determined to 21 m/s - also varies with U10N3 • Wave steepness (2 π Hs / g Tz2) has significant impact. • Wave development or wave age does seem to have less influence whitecap coverage (need analysis of full sea-state data set). • Wave radar spikes also depend on U10N3 Moat, B.I, M. J. Yelland and R. W. Pascal, 2010: The effect of environmental conditions on oceanic whitecap coverage. Geophysical Research Letters, in prep
Initial results - direct measurement of breaking waves. Development of a capacitance wave-wire spar buoy for open ocean deployments (SOLAS-DOGEE).Developed a novel method to distinguish between actively breaking waves and advected whitecap.Are we measuring microbreaking waves or large capillary waves? Would like to deploy alongside IR imaging equipment. Pascal R. W., M. J. Yelland, M. A. Srokosz, B. I. Moat, E. Waugh, D. Comben, A. Cansdale, M. Hartman, D. Coles, P. C. Huseh and T. G. Leighton. 2010: A spar buoy for high frequency wave measurements and detection of wave breaking in the open ocean. Journal of Atmospheric and Ocean Technology, in press Yelland, M. J., R. W. Pascal, M. A. Srokosz, B. I. Moat 2010: Ocean wave breaking and whitecap events as detected by capacitance wave wires. Geophys. Res. Letts IN PREP
JCR piggy-back cruises:- • Would like to add DMS flux measurements. • Would like to trial methane flux sensor but don’t have -methane capability. • JCR spends most time in southern ocean, but usually does one Arctic cruise per year too (before or after summer refit in the UK). • Wave radar only - need sanity check on wave heights. • Little control over where/when ship goes - have limited dedicated ship time. • 2010/11 ship schedule at https://secure.antarctica.ac.uk/south/reports/itinerary.ship.php?numTravelTypeID=2 • Longer-term planhttp://www.antarctica.ac.uk/living_and_working/research_ships/rrs_james_clark_ross/index.php • Other ships:- • We could deploy the wave-breaking buoy on a dedicated cruise. • Whitecap data - need continuous measurements to get enough data. We can process whitecap data. • Wave data. Need sanity check on wave heights from the wave radar system. • Limited ship time? Need lots of data (with delta pCO2 >30 ppm) to get a reasonable gas transfer relationship out.
Sea-state measurements • Ship Borne Wave Recorder - measures wave height directly, but no directional information. • X-band wave radar (WAVEX) - good directional information but infers wave heights (badly). • Combining the two systems gives a complete description of sea state. • James Clark Ross has wave radar only - need a sanity check on heights from a) routine visual obs, and b) ship motion. Black - swell dominated Red - fully developed seas Blue - wind sea dominated • YellandM. J., K. Bjorheim, C. Gommenginger, R. W. Pascal and B. I. Moat, 2007: In-situ wave measurements at Station Mike.10th International workshop on wave hindcasting and forecasting & coastal hazard assessment. Hawaii, November 11-16, 2007 JCOMM. http://www.waveworkshop.org/10thWaves/ProgramFrameset.htm
Acoustical Resonators (Helen Czerski) Broadband sound (5 kHz – 1 MHz) is transmitted between the plates. Bubbles significantly attenuate the resonant peaks at the natural frequency of the bubble. Accurate size distributions (5-300 mm), with one complete measurement every second. Each resonator is approximately 26 x 26 x 26 cm Farmer & Vagle, J. Atmos. & Oc. Tech (1998)
Optical fibre system (50 mm – 3 mm bubbles) Helen Czerski (Uni. Southampton) Acoustical resonators (5-300 mm bubbles) x Sidescan sonar