Download
1 / 48
490 likes | 644 Views
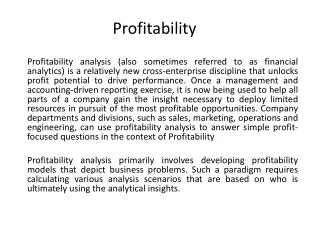
Profitability, Longevity and Growth. Profitability, Longevity and Growth. Grant Howard Grant W. Howard Company. Grant Howard: Expert on Inventory Management, System Utilization and “Getting Results” Works with Multiple Distributors, Associations and Software Houses

E N D
Profitability, Longevity and Growth Grant Howard Grant W. Howard Company 2
Grant Howard: • Expert on Inventory Management, System Utilization and “Getting Results” • Works with Multiple Distributors, Associations and Software Houses • Conceptual Designer Behind Sx.e’s AIM • Sits on Multiple Board of Directors • Founder of Grant W. Howard Company 3
Our Discussion Today • The Big Picture • The Replenishment Process • Better Results: • Customer Service • Profitability • Final Thoughts To Final Thoughts Today? 4
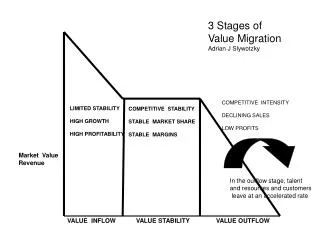
Longevity Profitability Growth Warehouse Owner’s Returns and Happiness Procure Sell Communication, Structure, and Team Education and Understanding Systems and Tools Processes and Procedures Customer Service Vendor Performance Employee Happiness The Fundamental Tree Service, GM Improvement, Asset Management, Efficiency, Accuracy 5
Profitability ($&%): GM Improvement ($&%): Sales Increase COGS Reduction Expense Reduction: Asset Management Efficiency Accuracy 1, 2, 5 Points Better? Longevity: Customer Loyalty: Customer Service Ability to Solve Customer Issues Being Dynamic: Adaptability to Market Changes Adaptability to Technology Changes and Utilization of Profitability, Longevity and Growth Growth: • Existing Customers • New Customers 6
GM Improvement ($&%): Sales Increase - Loyalty: Sell Price x 2 Velocity Pricing Lost Business and Backorders More of Customer’s Business New Business Increase Sales and Sell Price with ... COGS Reduction: Supplier Performance and Negotiations Decrease COGS with ... Expense Reduction: Asset Management: Freight Reduction Cost to Carry Reduction Rifle Approach Surplus, Safety Stock, RC/OC/OQ Replace Freight & Costs with ... Efficiency and Accuracy: Cost to Replenish Reduction Cost for Correction Reduction Replace Costs with ... Profitability, Longevity and Growth Profitability - Dollars and Percentage 7
Longevity: Customer Loyalty: Customer Service: Fill Rates Backorder Handling On-Time Delivery Accuracy - Product, Price, Quantity, Terms Ability to Solve Customer Issues Adaptability to Technology Changes and Utilization of Use Technology to ... Being Dynamic - its Critical: Adaptability to Market Changes Use Technology to ... Growth: Existing Customers: Lost Sales and Backorders Depth of Customer’s Business New Customers: Get them with Price Keep them with Service Profitability, Longevity and Growth 8
Procure: IM and Control Operations Sales Marketing Systems and Tech Sell: Sales Marketing IM and Control Operations Systems and Tech Profitability, Longevity and Growth Warehouse: • Operations • IM and Control • Systems and Tech • Sales • Marketing Seems to be a Pattern? Where does Management fit into all of this? 9
Customers: Availability Backorder Handling On-Time Delivery Accuracy Product Quantity Price Terms Win-Win MEASURE Employees: Want to do a Good Job Balanced Objectives/Team Tools, Processes, EDUCATE! Remove Stress, Give Method Win-Win MEASURE Vendors: Not Just Price Win-Win MEASURE Profitability, Longevity and Growth 10
Communication, Structure and Team:Does your company have a team concept, KNOWN balanced objectives, with a way to get there - Management? Systems and Tools:Does your company understand and use more than 20, 30, 50% of your systems and technology? Processes and Procedures: Does your company have closed-loop, actual working processes and procedures? Education and Understanding:Does your company educate your people and help them become part of the solution? Profitability, Longevity and Growth THE FOUNDATION 11
Inventory Management Getting Results When, What, How Much, Too Much 12
The Replenishment Model A Good Replenishment Model addresses the two objectives of Customer Service and Profitability When to Replenish? What to Replenish and How much? What is incoming and will be late? What is incoming and will be early or is not needed? Too Much? 13
“When” to Replenish Fixed Interval - Timeframe or Target - Profits only (Not watching BOP) Flexible Interval - Trigger Point (Order Point) - Service and Profits “What” to Replenish Replenishment Cycle (Line Point) Controls the frequency of P/O’s and Transfers This is the speed control (Frequency) Target/Freight and/or C to P driven “How Much” to Replenish Order Quantity Controls the quantity of items on P/O’s and Transfers This is the workload/spread (Amplitude) C to C, C to P and Target/Freight driven EOQ Order Cycle Surplus Point PNA/Level Line Point or Max/EOQ Lead Time Order Point or Min Safety “When, What and How Much” What’s the Difference RC = 0; RC = 1 week OQ = 1 week; OQ=4 weeks RC = 1 week & OQ=1 week; RC = 1 week & OQ = 4 weeks 14
Measurement Fill Rate, BO’s Turns, Excess, Mix T&E, GMROI Data to Info The Tools Data Usage - OE/WT Lead Time - PO/WT Level/PNA Info - OH & Paperfloat Purch Hist Replenishment Buyer’s Ctrl Center Items BOP/Priority The Numbers Hits/Ranking Order Cycle Ave Usage, Safety, OP, LP, Order Quantity Timeline Analysis Too Late Too Early Set-up “Smart” Set-up Co. and Whse. Product Pline Product Master Product Whse. Surplus Inventory External/Lng. Term Internal/St. Term Maintenance One Stop Inq/Maint Proofs/Mass Update Exc Control Center The Process 15
Know the Right Things to Do Do these Things Right Inventory Management is at the Time of Replenishment, the “When, What, and How Much”, Everything Else is Inventory Correction. 17
The Path to Success Service and Profits Keep it Working - Maintenance: • Get out of the “Yellow Sticky World” • The Importance of Proactive Maintenance • Watch for Suppressed with Activity • Watch for Slow/Inactive Stock Items Measure and Monitor: • Use Measurement and Monitoring to Confirm Results and to Drill Down and Find Areas of Improvement. • Drill in, Rifle Approach - Don’t Shotgun Approach it, Just $$$ and Disappointing Results. 19
If there is no measurement, then it is all hearsay. Data-free conversations and decisions will cause lots of frustrations, cost lots of money and result in lots of disappointments... 20
Service - Fill Rates • How well a business meets its customer’s needs - pulse of customer’s happiness/loyalty. • What to Measure: Fill Rates = Shipped/Ordered Quantity: 9 out of 10 = 90% Line Item SC: 9 out of 10 = 0% Order Ship Complete? • What Should Fill Rates Be? • The Report is Broken - Look at “First Pass” Orders - EDI, Fax, Internet, etc for true fill rates and backorder retention • Only one way to better Fill Rates - The Right Inventory. Two ways to the Right Inventory... 21
Profitability Turns Profits - Turns? ROI? Cost to Carry, Cost to Purchase and Freight C to PTurns 80’s $10.00 2-3 90’s $5.00 3-6 00’s $2-3.00 6-10 EDI/VMI $0.13? Many companies are increasing the turns, but the infrastructure does not support it; bottom line, longevity and growth are all suffering! Customer Service, GM Improvement, Efficiency, Accuracy, Asset Management 22
R O I TurnsWhat is it Measuring - Profits? J M/A J/J S/O D C/I Turns 1.00 s1.25 1/1 1 c1.00 1.00 s1.25 s1.25 2/1 2 c1.00 c1.00 1.00 s1.25 s1.25 s1.25 s1.25 4/1 4 c1.00 c1.00 c1.00 c1.00 CGM T&E GM% GMROI .25 .25 20% 20 .25 .50 20% 40 .25 1.00 20% 80 Turns looks at C to C - Don’t Forget Margin, Freight, C to P and SERVICE Turns DOES NOT measure Profits, Turns is an Indicator of Profits Inventory = Dollars! How many Times the Dollars are used to do Something 23
Inventory Management is not only Turns Customer Service Improvement - Availability, OTD, BO Handling Gross Margin Improvement - Sell Service (Price) and COGS Expense Reduction - Freight, Cost to Carry, Cost to Replenish Inventory Management is Bottom Line, Longevity and Growth 7 Turns & 4% Bottom Line or 5 Turns & 7% Bottom Line The “Whole” Picture Turns 4 5 6 7 Margin 35 30 25 20 Return 140 150 150 140 Velocity Pricing? 24
GMROI: = Turns CGM% = COGS GM Ave Inv COGS = Sls Turns GM% = Sales GM Ave Inv Sales = GM Ave Inv x x x x x x Return on Investment Turns: = COGS + $Transferred Ave Inv T&E: = Turns GM% = COGS GM Ave Inv Sales No Directs, Non-Stocks or Pass-Throughs How to Use T&E/GMROI 25
Customer Service Availability (Fill Rates) Proper Backorder Handling On Time Delivery Accuracy: Item, Quantity, Price Profitability (ROI) GM Improvement (Sales and Cost) Freight Considerations - OC Analysis Efficiency & Asset Mgt: CtoC and CtoP Surplus Inventory & Safety Inventory Turns/Days supply, ROI/T&E/GMROI Service Profits Inventory Management Objectives Watch the C to C (Warehousing, Handling, Obsol. & Shrink, Taxes, Ins, Interest) Watch the C to P (Purchasing/Replenishment, Receiving & Put-away, A/P) 26
1. Right Inventory/Service not Suffering because of Wrong 2. Controlled Replenishment 3. Stocking Policy 4. Good Numbers and Proper Use of Them (OP, Level, LP, and OQ) - Path to Service: Replenish at Order Point - Prio Freight, RC, CtoC vs Service Line Buy vs Emergency Buy Understand LP and OQ Effect Customer Service Back to Basics - JDI 5. Operations: • Backorder Policy and Handling • On-Time Delivery • Accuracy of Shipments and Billing 6. Fill Rates, BO’s, OTD, Accuracy - Monitor, Drill Down, Find Areas of Improvement 27
7. Understand and Use: Usage: Lost Sales, DP Customer Buying Habits Timeline Analysis NOOS Policy and Procedure Smart Selling/Transferring 8. Follow LP and EOQ Suggestions: Too many Fires BOP but not at Target Problems Customer Service Keys to Good Fill Rates 9. “Never-Arrive” Incoming 10. Safety Stock Increase: • Safety Analysis • Use a Rifle Approach • Small Steps, Results, ... • Watch the Profits Stellar Customer Service does not have to drive your inventory through the roof, it just has to be done smart. 28
Customer Service Availability (Fill Rates) Proper Backorder Handling On Time Delivery Accuracy: Item, Quantity, Price Profitability (ROI) GM Improvement (Sales and Cost) Freight Considerations - OC Analysis Efficiency & Asset Mgt: CtoC and CtoP Surplus Inventory & Safety Inventory Turns/Days supply, ROI/T&E/GMROI Service Profits Inventory Management Objectives Watch the C to C (Warehousing, Handling, Obsol. & Shrink, Taxes, Ins, Interest) Watch the C to P (Purchasing/Replenishment, Receiving & Put-away, A/P) 29
1. Stellar Customer Service 2. Controlled Replenishment 3. Stocking Policy 4. Good Numbers and Proper Use of Them (OP, LP, OQ, Level) - Path to Profitability: Up to LP, OQ, Min, Package Usage: Exceptional, DP Targets/Incentives Properly Line Buy vs Emergency Buy Availability (Sales, GM, Fires) At Target/Timeframe, no BOP Profitability Back to Basics - JDI 5. Vendor Performance and Negotiations 6. T&E and/or GMROI - Monitor, Drill Down, Find Areas of Improvement 30
Lower COGS Lower Freight Minimums Multiple Drops for Freight Combined P/O’s for Minimum Freight Paid Fill-ins Fill Rates Consistent Lead Times and OTD Accurate Shipping (Blanket Receiving) - Product, Quantity, Price Good Backorder Handling EDI/VMI/2-Way Information Flow - B2B Automated Product and Pricing Updates RGA’s on New Items Excess Inventory Returns Win/Win - Partnership Vendor Performance and Negotiations - It’s not just Price 31
7. Excess and Defective Inventory: Prevention Disposition 8. Order Quantity Reduction: OC/RC (LP) Reduction: OC/RC Analysis/Paths, Watch Freight Lower Targets - Negotiate C to P Departments Tools/ Efficiency Suggested OQ Reduction (EOQ): Watch C to P Departments Proper C to C Profitability Inventory Reduction/Increasing Turns 9. Safety Stock Reduction: • Safety Analysis - Use Rifle Approach • Improve the Process - Better Usage, Lead Time and Level, Replenish at OP, Timeline • Small Steps, Results, …, ... • Watch the Service 10. Other Reductions: • “Never-Ship” Committed • Duplicate Products and Lines Turns the Right Way! Balanced Objectives - Increase turns/decrease inventory but DON’T EFFECT SERVICE! 32
EOQ Order Cycle Surplus Point PNA/Level Line Point or Max/EOQ Lead Time Order Point or Min Safety Profitability Low Risk Understand the Impact Areas: • Excess and Defective: • No one wants or needs • Control the Feelings • Let it Roll, Let it Go • Be Careful - C to C/Mix • Cost of Disposition • Line Point and Order Quantity: • “What” and “How Much” • Be Careful - C to P Departments • Order Point - Safety Stock: • “When” • Be Careful - Customer Service High Risk 33
Excess Inventory Disposition BOP/GAP - Put of the fire: Short or Long Term BLP/Sugg Xfers - Use it where you can: Long Term Teach branches to use LT first. Don’t borrow stock and put branch in “need”. 1. Stock Balance: (“X” Months Supply) - With “To” branch approval/Before Buy 2. Sell Above Cost: Customer, Other Distributor 3. At Cost: Sell at cost, Return at cost with no charges (freight, restock) 4. Below Cost: Sell below cost, Return below cost and/or with charges 5. Sell Above “Write-off” Cost: Garage/Fire Sale, Flea Market, Auction House, Liquidation House 6. Dump at “Write-off” Cost: Donate, Scrap, Dump 34
Cost to Carry, Freight, and Service Versus Cost to Replenish HIRE SOMEONE 35
1. Order Point 2. Stock Level 3. “When” to Replenish 4. Stock Out/Lost Business Prevention -Timeline Analysis -”Too Late” 5. Closed-loop Backorder Process 1. Line Point and Order Quantity 2. Stock Level 3. “What & How Much” to Replenish 4. Surplus Prevention - Timeline Analysis -”Too Early” 5. Inventory Reduction Program Service Profits Getting Results Most “Talk About” 1 and 2, Many Do Not Understand 3 and Few Do 4 and 5 37
12 Months to Better Service and Profits Execution Is the Key - One Action Each Month 1. Good Usage: Lost/Exceptional Sales, Usage Roll-up, Seasonal Trending, DP 2. Implement Customer Buying Habits/Average Ship Quantities 3. Stock Level Accuracy: On Hand Integrity and Paperfloat Control 4. Buyer’s Control Center: Replenish at OP Priority, Targets, EB vs LB, One-stop 5. Order Cycle Analysis and Proper use of EOQ - Understand and Use Properly 6. Timeline Analysis: “Too Late” and “Too Early” 7. “Smart” Inventory Reduction Program, including Excess Prevention and Disposition 8. Inventory Stocking Policy and “Product Add” Procedure 9. Controlled Replenishment: Centralized Replenishment and Maintenance 10. Backorder Policy and Flawless Backorder Handling System 11. Data and Parameters: Smart Parameters (Depth, Cost and Hits/Rank Balance), Smart Exception Reports and Proactive Maintenance 12. Measure and Improve and Don’t Measure Just to Measure 38
J D I It’s too hard to log lost and exceptional sales It’s too hard to keep the paper work clean It’s too hard to keep the on-hand correct It’s too hard to work excess inventory It’s too hard ... It’s too hard..., The system is broken or doesn’t have it…, We will never get them to do that…, We don’t know how to do that… J D I ! 39
Spend $ to Make/Save $$ Execution Is the Key - How to Get it Done • Get an IM, Operations and Education Person! • Understand the IM models, How the “Dials” Work and How to Meet the Objectives (Service and Profits; OP, LP, OQ) • Understand and Utilize the System and People Better - Better Tools, Better Processes, Better Education, Better Objectives - All Departments, Entire Company - SAME OBJECTIVES, SAME TEAM • You Don’t Have to do the Extraordinary, Just do the Basics Extraordinary • No Magic, Common Sense, Back to Basics • Maximize Profits and Service, Asset Management, Cost Reduction and Increase Turns the Right Way! 40
It’s not just good Software and Systems It’s not just good Processes and Procedures It’s not just good People and Education It’s not just good Management IT’S ALL OF THEM! It’s not just good Usage It’s not just good Order Points It’s not just replenishing at Order Point It’s not just the Timeline It’s not just working the Surplus IT’S THE ENTIRE PROCESS 41
Back to Basics Many distributors DON’T: • Set the system up properly • Feed the system good data • Understand or Use the system properly • Clean up bad processes and procedures • Educate their people on the system or processes • Help departments work together • Help work towards common goals Yet they think it will all just magically work 42
Spend your days reacting to the fires... you may be efficient, but will you be effective? Fire Prevention ... 43
The World is Changing! YesterdayTodayTomorrow Buyers/Inv. Control Inventory/Asset Managers ??? Turns Dominated Customer Service Oriented If you can’t Inaccurate Data Data/Information Managers handle today, Four Glass Walls Communications & Team how will you Learned from “Bill” Education & Understanding handle Pencil and Paper Technology and Efficiency tomorrow? If your company is stuck in Yesterday or having troubles with Today, how will it survive Tomorrow? 44
Replace Inventory and Costs and Improve Service with Technology Improve Profits, Longevity and Growth with Technology 45
www.gwhco.org Grant Howard: ghoward@gwhco.org 734-428-0529 Phone 734-428-0593 Fax John Cason: jcason@gwhco.org 256-830-0676 Phone 256-830-0481 Fax Our approach involves tailoring the best practices in distribution to the specific needs of our clients. Our working philosophy revolves around building a strong and self-maintaining infrastructure by developing a working plan based on processes and procedures, education and understanding, implementation of tools and technology; and through communication, organizational structure and team environments. GWHCO 46