Download
1 / 31
310 likes | 601 Views
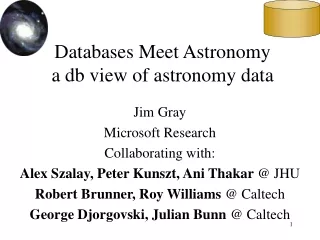
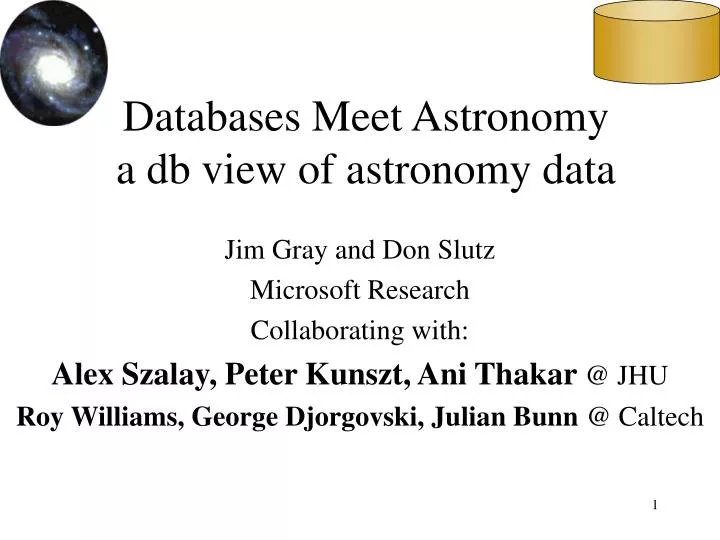
Databases Meet Astronomy a db view of astronomy data. Jim Gray and Don Slutz Microsoft Research Collaborating with: Alex Szalay, Peter Kunszt, Ani Thakar @ JHU Roy Williams, George Djorgovski, Julian Bunn @ Caltech. Outline. Astronomy data The Virtual Observatory Concept

E N D
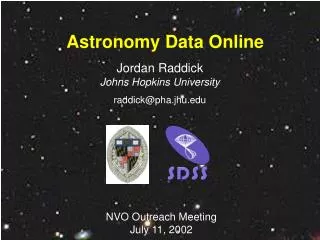
Databases Meet Astronomya db view of astronomy data Jim Gray and Don Slutz Microsoft Research Collaborating with: Alex Szalay, Peter Kunszt, Ani Thakar @ JHU Roy Williams, George Djorgovski, Julian Bunn @ Caltech
Outline • Astronomy data • The Virtual Observatory Concept • The Sloan Digital Sky Survey
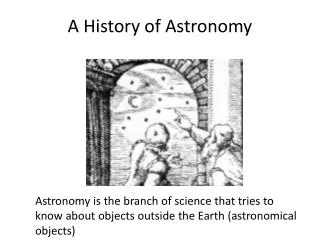
Astronomy Data • In the “old days” astronomers took photos. • Starting in the 1960’s they began to digitize ( true?). • New instruments are digital (100s of GB/nite) • Detectors are following Moore’s law. • Data avalanche: double every 2 years Total area of 3m+ telescopes in the world in m2, total number of CCD pixels in megapixel, as a function of time. Growth over 25 years is a factor of 30 in glass, 3000 in pixels. 3+ M telescopes area m^2 Courtesy of Alex Szalay CCD area mpixels
Astronomy Data • Astronomers have a few Petabytes now. • They mine it looking fornew (kinds of) objects or more of interesting ones(quasars), density variations in 400-D space correlations in 400D space • Data doubles every 2 years. • Data is public after 2 years. • So, 50% of the data is public. • Some have private access to 5% more data. • So: 50% vs 55% access for everyone
Astronomy Data • But….. • How do I get at that 50% of the data? • Astronomers have culture of publishing. • FITS files and many tools.http://fits.gsfc.nasa.gov/fits_home.html • Encouraged by NASA. • But, data “details” are hard to document. Astronomers want to do it but it is VERY hard.(What programs where used? what were the processing steps? How were errors treated?…) • The optimistic hope: XML is the answer. • The reality: xml is syntax and tools: FITS on XML will be good but….. Explaining the data will still be very difficult.
Astronomy Data • And by the way, few astronomers have a spare petabyte of storage in their pocket. • But that is getting better: • Public SDSS is 5% of total • Public SDSS is ~50GB • Fits on a 200$ disk drive today. • (more on that later). • THESIS: Challenging problems are publishing data providing good query & visualization tools
Outline • Astronomy data • The Virtual Observatory Concept • The Sloan Digital Sky Survey
Virtual Observatoryhttp://www.astro.caltech.edu/nvoconf/ • Premise: Most data is (or could be online) • So, the Internet is the world’s best telescope: • It has data on every part of the sky • In every measured spectral band: optical, x-ray, radio.. • As deep as the best instruments (2 years ago). • It is up when you are up.The “seeing” is always great (no working at night, no clouds no moons no..). • It’s a smart telescope: links objects and data to literature on them.
Virtual Observatory The Age of Mega-Surveys MACHO 2MASS DENIS SDSS PRIME DPOSS GSC-II COBE MAP NVSS FIRST GALEX ROSAT OGLE ... • Large number of new surveys • multi-TB in size, 100 million objects or more • individual archives planned, or under way • Data publication an integral part of the survey • Software bill a major cost in the survey • Multi-wavelength view of the sky • more than 13 wavelength coverage in 5 years • Impressive early discoveries • finding exotic objects by unusual colors • L,T dwarfs, high-z quasars • finding objects by time variability • gravitational micro-lensing Slide courtesy of Alex Szalay, modified by jim
Virtual Observatory Federating the Archives • The next generation mega-surveys are different • top-down design • large sky coverage • sound statistical plans • well controlled/documented data processing • Each survey has a publication plan • Data mining will lead to stunning new discoveries • Federating these archives Virtual Observatory Slide courtesy of Alex Szalay
Virtual Observatory and Education • In the beginning science was empirical. • Then theoretical branches evolved. • Now, we have a computational branches. • The computational branch has been simulation • It is becoming data analysis/visualization • The Virtual Observatory can be used to • Teach astronomy:make it interactive, demonstrate ideas and phenomena • Teach computational science skills
Virtual Observatory Challenges • Size : multi-Petabyte 40,000 square degrees is 2 Trillion pixels • One band 4 Terabytes • Multi-wavelength 10-100 Terabytes • Time dimension 10 Petabytes • Need auto parallelism tools • Unsolved MetaData problem • Hard to publish data & programs • Hard to find/understand data & programs • Current tools inadequate • new analysis & visualization tools • Transition to the new astronomy • Sociological issues
Demo of Virtual Sky • Roy Williams @ CaltechPalomar Data with links to NED. • Shows multiple themes, shows link to other sites (NED, VizeR, Sinbad, …) • http://virtualsky.org/servlet/Page?T=3&S=21&P=1&X=0&Y=0&W=4&F=1 And NED @ http://nedwww.ipac.caltech.edu/index.html
Demo of Sky Server Alex Szalay of Johns Hopkins has built a prototype sky Server (based on TerraServer design). http://dart.pha.jhu.edu/sdss/getMosaic.asp?Z=1&A=1&T=4&H=1&S=10&M=24
Outline • Astronomy data • The Virtual Observatory Concept • The Sloan Digital Sky Survey
Sloan Digital Sky Survey http://www.sdss.org/ • For the last 12 years a group of astronomers has been building a telescope (with funding from Sloan Foundation, NSF, and a dozen universities). 90M$. • Last year was engineer, calibrate, commission They are making the calibration data public. • 5% of the survey, 600 sq degrees, 15 M objects 60GB. • This data includes most of the known high z quasars. • It has a lot of science left in it but… that is just the start. • Now the data is arriving: • 250GB/nite (20 nights per year). • 100 M stars, 100 M galaxies, 1 M spectra. • http://www.sdss.org/ and http://www.sdss.jhu.edu/
SDSS what I have been doing • Work with Alex Szalay, Don Slutz, and others to define 20 canonical queries and 10 visualization tasks. • Don Slutz did a first cut of the queries, I’m continuing that work. • Working with Alex Szalay on building Sky Server and making data it public (send out 80GB SQL DBs)
Two kinds of data • 15M Photo Objects ~ 400 attributes 20K Spectra with ~10 lines/ spectrum
Spatial Data Access(Szalay, Kunszt, Brunner)http://www.sdss.jhu.edu/ look at the HTM link • Implemented Hierarchical Triangular Mesh (HTM) as table-valued function for spatial joins. • Every object has a 20-deep Mesh ID. • Given a spatial definition:Routine returns up to 500 covering triangles. • Spatial query is then up to 500 range queries. • Very fast: 1,000s of triangles per second.
Q11: Find all elliptical galaxies with spectra that have an anomalous emission line. Q12: Create a grided count of galaxies with u-g>1 and r<21.5 over 60<declination<70, and 200<right ascension<210, on a grid of 2’, and create a map of masks over the same grid. Q13: Create a count of galaxies for each of the HTM triangles which satisfy a certain color cut, like 0.7u-0.5g-0.2i<1.25 && r<21.75, output it in a form adequate for visualization. Q14: Find stars with multiple measurements and have magnitude variations >0.1. Scan for stars that have a secondary object (observed at a different time) and compare their magnitudes. Q15: Provide a list of moving objects consistent with an asteroid. Q16: Find all objects similar to the colors of a quasar at 5.5<redshift<6.5. Q17: Find binary stars where at least one of them has the colors of a white dwarf. Q18: Find all objects within 30 arcseconds of one another that have very similar colors: that is where the color ratios u-g, g-r, r-I are less than 0.05m. Q19: Find quasars with a broad absorption line in their spectra and at least one galaxy within 10 arcseconds. Return both the quasars and the galaxies. Q20: For each galaxy in the BCG data set (brightest color galaxy), in 160<right ascension<170, -25<declination<35 count of galaxies within 30"of it that have a photoz within 0.05 of that galaxy. Q1: Find all galaxies without unsaturated pixels within 1' of a given point of ra=75.327, dec=21.023 Q2: Find all galaxies with blue surface brightness between and 23 and 25 mag per square arcseconds, and -10<super galactic latitude (sgb) <10, and declination less than zero. Q3: Find all galaxies brighter than magnitude 22, where the local extinction is >0.75. Q4: Find galaxies with an isophotal surface brightness (SB) larger than 24 in the red band, with an ellipticity>0.5, and with the major axis of the ellipse having a declination of between 30” and 60”arc seconds. Q5: Find all galaxies with a deVaucouleours profile (r¼ falloff of intensity on disk) and the photometric colors consistent with an elliptical galaxy. The deVaucouleours profile Q6: Find galaxies that are blended with a star, output the deblended galaxy magnitudes. Q7: Provide a list of star-like objects that are 1% rare. Q8: Find all objects with unclassified spectra. Q9: Find quasars with a line width >2000 km/s and 2.5<redshift<2.7. Q10: Find galaxies with spectra that have an equivalent width in Ha >40Å (Ha is the main hydrogen spectral line.) The 20 Queries Also some good queries at: http://www.sdss.jhu.edu/ScienceArchive/sxqt/sxQT/Example_Queries.html
An easy oneQ7: Provide a list of star-like objects that are 1% rare. • Found 14,681 buckets, first 140 buckets have 99% time 104 seconds • Disk bound, reads 3 disks at 68 MBps. Select cast((u-g) as int) as ug, cast((g-r) as int) as gr, cast((r-i) as int) as ri, cast((i-z) as int) as iz, count(*) as Population from stars group by cast((u-g) as int), cast((g-r) as int), cast((r-i) as int), cast((i-z) as int) order by count(*)
Another easy oneQ15: Provide a list of moving objects consistent with an asteroid. • Looks hard but there are 5 pictures of the object at 5 different times (colors) and so can compute velocity. • Image pipeline computes velocity. • Computing it from the 5 color x,y would also be fast • Finds 2167 objects in 7 minutes, 70MBps. select object_id, -- return object ID sqrt(power(rowv,2)+power(colv,2)) as velocity from sxPhotObj -- check each object. where (power(rowv,2) + power(colv, 2)) > 50 -- square of velocity and rowv >= 0 and colv >=0 -- negative values indicate error
Returns a table of nearby objects select S.object_ID, S1.object_ID -- return stars that from Stars S, -- S is a star getNearbyObjEq(s.ra, s.dec, 0.017) as N -- N within 1 arcsec (3 pixels) of S. Stars S1 -- N == S1 (S1 gets the colors) where S.Object_ID < N.Object_ID -- S1 different from S == N and N.Type = dbo.PhotoType('Star') -- S1 is a star (an optimization) and N.object_ID = S1.Object_ID -- N == S1 and ( abs(S.u-S1.u) > 0.1 -- one of the colors is different. orabs(S.g-S1.g) > 0.1 orabs(S.r-S1.r) > 0.1 orabs(S.i-S1.i) > 0.1 orabs(S.z-S1.z) > 0.1 ) order by S.object_ID, S1.object_ID -- group the answer by parent star. A Hard OneQ14: Find stars with multiple measurements that have magnitude variations >0.1. • This should work, but SQL Server does not allow table values to be piped to table-valued functions. • This should work, but SQL Server does not allow table values to be piped to table-valued functions.
A Hard one: Second TryQ14: Find stars with multiple measurements that have magnitude variations >0.1. ------------------------------------------------------------------------------- -- Table-valued function that returns the binary stars within a certain radius -- of another (in arc-minutes) (typically 5 arc seconds). -- Returns the ID pairs and the distance between them (in arcseconds). create function BinaryStars(@MaxDistanceArcMins float) returns @BinaryCandidatesTable table( S1_object_ID bigint not null, -- Star #1 S2_object_ID bigint not null, -- Star #2 distance_arcSec float) -- distance between them as begin declare @star_ID bigint, @binary_ID bigint;-- Star's ID and binary ID declare @ra float, @dec float; -- Star's position declare @u float, @g float, @r float, @i float,@z float; -- Star's colors ----------------Open a cursor over stars and get position and colors declare star_cursor cursor for select object_ID, ra, [dec], u, g, r, i, z from Stars; open star_cursor; while (1=1) -- for each star begin -- get its attribues fetch next from star_cursor into @star_ID, @ra, @dec, @u, @g, @r, @i, @z; if (@@fetch_status = -1) break; -- end if no more stars insertinto @BinaryCandidatesTable -- insert its binaries select @star_ID, S1.object_ID, -- return stars pairs sqrt(N.DotProd)/PI()*10800 -- and distance in arc-seconds from getNearbyObjEq(@ra, @dec, -- Find objects nearby S. @MaxDistanceArcMins) as N, -- call them N. Stars as S1 -- S1 gets N's color values where @star_ID < N.Object_ID -- S1 different from S and N.objType = dbo.PhotoType('Star') -- S1 is a star and N.object_ID = S1.object_ID -- join stars to get colors of S1==N and (abs(@u-S1.u) > 0.1 -- one of the colors is different. or abs(@g-S1.g) > 0.1 or abs(@r-S1.r) > 0.1 or abs(@i-S1.i) > 0.1 or abs(@z-S1.z) > 0.1 ) end; -- end of loop over all stars -------------- Looped over all stars, close cursor and exit. close star_cursor; -- deallocate star_cursor; return; -- return table end -- end of BinaryStars GO select * from dbo.BinaryStars(.05) • Write a program with a cursor, ran for 2 days
A Hard one: Third TryQ14: Find stars with multiple measurements that have magnitude variations >0.1. • Use pre-computed neighbors table. • Ran in 17 minutes, found 31k pairs. ================================================================================== -- Plan 2: Use the precomputed neighbors table select top 100 S.object_ID, S1.object_ID, -- return star pairs and distance str(N.Distance_mins * 60,6,1) as DistArcSec from Stars S, -- S is a star Neighbors N, -- N within 3 arcsec (10 pixels) of S. Stars S1 -- S1 == N has the color attibutes where S.Object_ID = N.Object_ID -- connect S and N. and S.Object_ID < N.Neighbor_Object_ID -- S1 different from S and N.Neighbor_objType = dbo.PhotoType('Star')-- S1 is a star (an optimization) and N.Distance_mins < .05 -- the 3 arcsecond test and N.Neighbor_object_ID = S1.Object_ID -- N == S1 and ( abs(S.u-S1.u) > 0.1 -- one of the colors is different. orabs(S.g-S1.g) > 0.1 orabs(S.r-S1.r) > 0.1 orabs(S.i-S1.i) > 0.1 orabs(S.z-S1.z) > 0.1 ) -- Found 31,355 pairs (out of 4.4 m stars) in 17 min 14 sec.
Count parent objects 503 seconds for 14.7 M objects in 33.3 GB 66 MBps IO bound (30% of one cpu) 100 k records/cpu sec Use a cursor No cpu parallelism CPU bound 6 MBps, 2.7 k rps 5,450 seconds (10x slower) The Pain of Going Outside SQL(its fortunate that all the queries are single statements) declare @count int; declare @sum int; set @sum = 0; declare PhotoCursor cursor for select nChild from sxPhotoObj; open PhotoCursor; while (1=1) begin fetch next from PhotoCursor into @count; if (@@fetch_status = -1) break; set @sum = @sum + @count; end close PhotoCursor; deallocate PhotoCursor; print 'Sum is: '+cast(@sum as varchar(12)) select count(*) from sxPhotoObj where nChild > 0
Summary of Current Status • 19 of 20 queries run(still need to check the science) • Also 14 of 15 “user” queries • Run times: on 3k$ PC (2 cpu, 4 disk, 256MB) ~100 IO/cpu sec ~5MB/cpu sec
Summary of Current Status • 16 of the queries are simple • 2 are iterative, 2 are unknown • Many are sequential one-pass and two-pass over data • Covering indices make scans run fast • Table valued functions are wonderful but limitations on parameters are a pain. • Counting is VERY common. • Binning (grouping by some set of attributes) is common • Did not request cube, but that may be cultural.
Reflections on the 20 Queries • Data loading/scrubbing is labor intensive & tedious • AUTOMATE!!! • This is 5% of the data, and some queries take an hour. • But this is not tuned (disk bound). • All queries benefit from parallelism (both disk and cpu)(if you can state the query right, e.g. inside SQL). • Parallel database machines will do great on this: • Hash machines • Data pumps • See paper in word or pdf on my web site. • Bottom line: SQL looks good.Once you get the answers, you need visualization
What Next?(after the queries, after the web server) • How to federate the Archives to make a VO? • Send XML: a non-answer equivalent to “send unicode” • Define a set of Astronomy Objects and methods. • Based on UDDI, WSDL, SOAP. • Each archive is a service • We have started this with TerraService • http://terraserver.microsoft.net/TerraService.htmshows the idea. • Working with Caltech (Williams, Djorgovski, Bunn) and JHU (Szalay et al) on this
Call to Action • If do data visualization: we need you(and we know it). • If do databases:here is some data you can practice on. • If you do distributed systems:here is a federation you can practice on. • The astronomy folks are very good, and very smart, and a pleasure to work with, and the questions are cosmic, so …