Download
1 / 26
260 likes | 332 Views
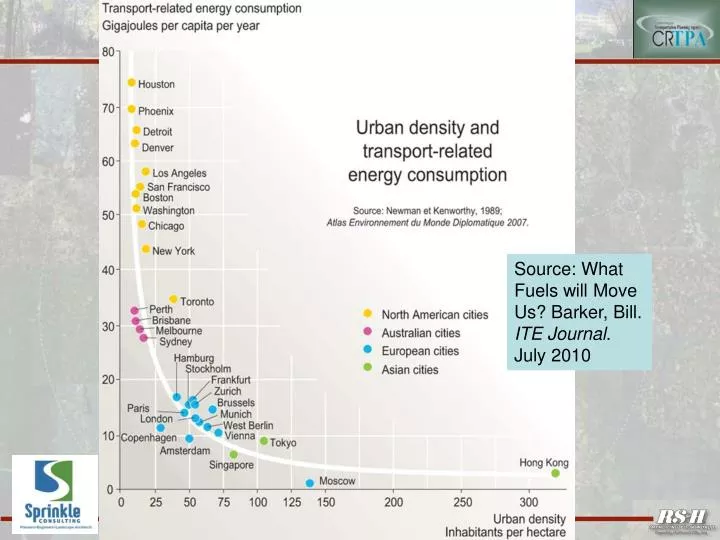
Source: What Fuels will Move Us? Barker, Bill. ITE Journal . July 2010. One Key to Directing Growth…. Graphic from K2 Urban Corp. 1. Plan & Influence Development Economics. Regional Growth “Engines”. 50,000 students & employees. 50,000 + employees. 15,000 students & employees.

E N D
Source: What Fuels will Move Us? Barker, Bill. ITE Journal. July 2010
One Key to Directing Growth… Graphic from K2 Urban Corp 1. Plan & Influence Development Economics
Regional Growth “Engines” 50,000 students & employees 50,000 + employees 15,000 students & employees 15,000 students & employees
RMP Development Scenarios “Quality Growth Plus” (Compact / Infill) Business-as-Usual (Scattered / Linear) Quality Growth (Contiguous / USA fringe)
Long-term Operation & Maintenance Commitment Education………………….. Public Safety..……………. Roads………………………. Wastewater……………….. Fire/Rescue; Water; Parks; Solid Waste.......... 40% 8% 30% 11% 11% Public ServicePercent of Avg. Annual Cost Source: Duncan and Associates. The Search for Efficient Urban Growth Patterns: A Study of Fiscal Impacts of Florida Development. Governor’s Task Force on Urban Growth Patterns and DCA. Tallahassee FL, 1989.
Impacts on Traffic Activity Form / Location Business-as-Usual (Scattered / Linear) Quality Growth (Contiguous / USA fringe) “Quality Growth Plus” (Compact / Infill) Avg. Traffic Trip Length Duncan’89FDOT (335.067, F.S.)Weighted Avg. 8.3 mi 12.1mi 11.2mi 6.4mi 9.6mi 8.8mi 6.8mi 4.9mi 5.4mi
Streets & Roadways Maintenance * Excluding I-10 Costs and Traffic Data Sources: City of Tallahassee Annual Budget, Leon County Annual Budget, Leon County CIP, FDOT Historical Work Program, and FDOT Countywide VMT Estimate
Costs of Development Location (P/A, 3%, 35)
You can affect Development Location Decisions… Graphic from K2 Urban Corp
Land Development ProForma Revenue (Sales) $11,250,000 Costs Land Acquisition $ 1,800,000 Site Infrastructure $ 900,000 Product Cost (COGS) $ 5,000,000 Transportation $ 400,000 Interest Carry (5yrs) $ 1,200,000 Subtotal $ 9,300,000 Potential Margin / ROI $ 1,950,000 (20%) (Off-site infrastructure)
Land Development ProForma Revenue (Sales) $11,250,000 Costs Land Acquisition $ 1,800,000 Site Infrastructure $ 900,000 Product Cost (COGS) $ 5,000,000 Transportation $ 400,000 Interest Carry (5yrs) $ 1,200,000 Subtotal $ 9,300,000 Potential Margin / ROI $ 1,950,000 (20%) Here is what you can influence… (Off-site infrastructure) 17%
Land Development ProForma Revenue (Sales) $11,250,000 Costs Land Acquisition $ 1,800,000 Site Infrastructure $ 900,000 Product Cost (COGS) $ 5,000,000 Transportation $ 400,000 Interest Carry (5yrs) $ 1,200,000 Subtotal $ 9,300,000 Potential Margin / ROI $ 1,950,000 (20%) Reduce Interest Carry… (Off-site infrastructure)
Land Development ProForma Revenue (Sales) $11,250,000 Costs Land Acquisition $ 1,800,000 Site Infrastructure $ 900,000 Product Cost (COGS) $ 5,000,000 Transportation $ 400,000 Interest Carry (4yrs) $ 900,000 Subtotal $ 9,000,000 Potential Margin / ROI $ 2,250,000 (25%) Reduce Interest Carry… (Off-site infrastructure) Build There!!!
Land Development ProForma Revenue (Sales) $11,250,000 Costs Land Acquisition $ 1,800,000 Site Infrastructure $ 900,000 Product Cost (COGS) $ 5,000,000 Transportation $ 400,000 Interest Carry (5yrs) $ 1,200,000 Subtotal $ 9,300,000 Potential Margin / ROI $ 1,950,000 (20%) Here is what you can influence…. (Off-site infrastructure)
Land Development ProForma Revenue (Sales) $11,250,000 Costs Land Acquisition $ 1,800,000 Site Infrastructure $ 900,000 Product Cost (COGS) $ 5,000,000 Transportation $ 40,000 Interest Carry (5yrs) $ 1,200,000 Subtotal $ 8,940,000 Potential Margin / ROI $ 2,310,000 (26%) Here is what you’ve helped…. (Off-site infrastructure) Build There!!!
Land Development ProForma Revenue (Sales) $11,250,000 Costs Land Acquisition $ 1,800,000 Site Infrastructure $ 900,000 Product Cost (COGS) $ 5,000,000 Transportation $ 40,000 Interest Carry (4yrs) $ 900,000 Subtotal $ 8,640,000 Potential Margin / ROI $ 2,610,000 (30%) Direct Incentives… (Off-site infrastructure) Build There!!!
Parcel Assemblage v. Simple Purchase I know there is a market need for my product, where should I buy the land?
Parcel Assemblage v. Simple Purchase Lemme see, should I try to deal with 12 sellers and their attorneys, or just Farmer Brown?
Guiding Growth through Development Economics Regional Growth Influence Areas Proforma Category Influence / Action Revenue (Sales)……. Costs Land Acquisition…… Site Infrastructure…… Product Cost (COGS) Transportation…… Interest Carry………. Public Investment - Community Fabric; Public Transit; Active Transportation; Streetscapes; Public Education; etc. Density / Property Yield n/a n/a Incentives/Disincentives Streamline Permitting


![Welcome to Class # 1 [Monday July 5 th , 2010]](https://cdn2.slideserve.com/3926926/the-psychology-education-of-students-with-adhd-hdp3238h-instructor-rosemary-tannock-phd-dt.jpg)