Download
1 / 16
160 likes | 253 Views
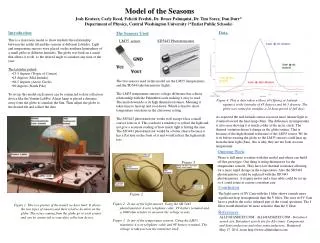
The d emographic t ransition m odel. The DTM. Aims of today’s lesson. To learn about the demographic transition model. To learn how it can track and explain population growth through time and in different countries. Lesson Starter – what do the key words mean?.

E N D
Aims of today’s lesson • To learn about the demographic transition model. • To learn how it can track and explain population growth through time and in different countries.
Lesson Starter – what do the key words mean? • Birth rate – the number of births per 1000 people in a population per year. • Death rate - the number of deaths per 1000 people in a population per year. • Infant mortality rate – the number of children under the age of 1 that die per year (also shown as per 1000) • Life expectancy – the average age a person will live to. • Natural increase – the amount the population is rising due to the birth rate being higher than the death rate.
Task 1 • Picture from memory. • Working in groups of 4 you will each take a turn to come up and see a picture that the teacher is holding. You must then return to your table and try to recreate that picture in as much detail as possible.
Task 1 • Picture from memory. • Rules: • Only one person is allowed to draw at a time. • You must all take your own turn. • Listen to the teachers instructions at all times.
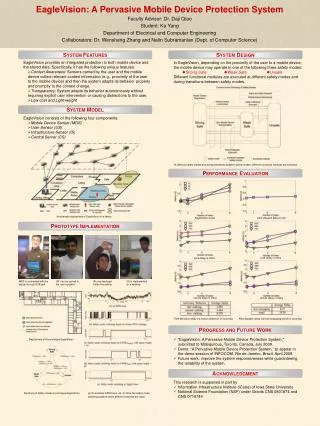
Death rate drops rapidly due to advances in medicine and improved sanitation. Birth rate and Death rate are high due to lack of contraception and poor health care. Birth rate is begins to drop with the introduction of family planning and contraception. Population is high but steadies out. Population low and steady because of both high birth and death rate. Population begins to increase because of continued high birth rate and falling death rate.
As well as showing one developed country over time what else do you think that this could represent? 1700’s 1760-1830 1830 - 1940 1950 + 2000 + Scotland
DTM group task • In your groups you will have been given a Demographic Transition Model that has been put onto a piece of poster paper. • We are going to create a Living Graph. • To do this you must annotate on the statements that you have been given in the places that you think they should go.
When you have added all of the statements that you have been given you must think up some of your own and write them on to the poster paper. Contraception has not yet been invented.
Extension task • Add each of these statements to your DTM in the correct place. • Penicillin is discovered. • Free contraception is given out for the first time in history. • Infant mortality is at an all time low. • Make up some statements of your own and add them to your group’s DMT. Be ready to test the class with them later.
Task: Q) Describe and Explain the different stages of the DTM. Success criteria: Developing: 2 stages completed. Consolidating: 3 stages completed. Secure: 5 stages completed.
The demographic transition model. Lesson 2
1700’s 1760-1830 1950 + 2000 + 1830 - 1940 Scotland
Q) Describe the changes in the DTM throughout the stages in detail. 5 ES 1700’s 1760-1830 1950 + 2000 + 1830 - 1940 Scotland
Q) Explain the changes in the DTM throughout the stages in detail. 5 ES Discuss with the people next to you come up with an answer. 1700’s 1760-1830 1950 + 2000 + 1830 - 1940 Scotland