Download
1 / 22
220 likes | 301 Views
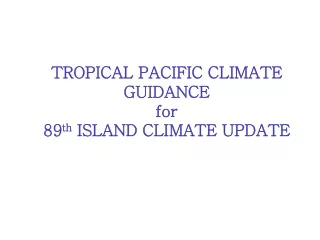
TROPICAL PACIFIC CLIMATE GUIDANCE for 89 th ISLAND CLIMATE UPDATE. Climate Developments January 2008. Seasonal mean circulation. http://www.cdc.noaa.gov/map/images/rnl/sfcwnd_90a.rnl.html. Monthly mean circulation. http://www.cdc.noaa.gov/map/images/rnl/sfcwnd_30a.rnl.html.

E N D
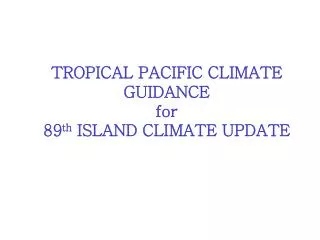
TROPICAL PACIFIC CLIMATE GUIDANCEfor 89th ISLAND CLIMATE UPDATE
Seasonal mean circulation http://www.cdc.noaa.gov/map/images/rnl/sfcwnd_90a.rnl.html
Monthly mean circulation http://www.cdc.noaa.gov/map/images/rnl/sfcwnd_30a.rnl.html
BMRC SST anomalies http://www.bom.gov.au/climate/current/anomsst.shtml
CDC SST Anomalies http://www.cdc.noaa.gov/map/images/sst/sst.anom.month.gif
BoM OLR and anomalies http://www.bom.gov.au/bmrc/clfor/cfstaff/matw/maproom/OLR/m.lm.html
BMRC MJO monitoring http://www.bom.gov.au/bmrc/clfor/cfstaff/matw/maproom/RMM/phase.Last40days.html http://www.bom.gov.au/bmrc/clfor/cfstaff/matw/maproom/RMM/hov.recon+anom.olr.gif http://www.bom.gov.au/bmrc/clfor/cfstaff/matw/maproom/RMM/index.htm
Madden- Julian Oscillation at 26/01/2008 Current BMRC MJO: Phase 1 MSLP anomalies for MJO-phase 1 (Blue: negative → rainy) http://www.apsru.gov.au/mjo/current.asp http://www.apsru.gov.au/mjo/current.asp
Statistical OLR MJO Forecast http://www.bom.gov.au/bmrc/clfor/cfstaff/matw/maproom/RMM/fcsts/m.anom.OLR.uv850.gif http://www.bom.gov.au/bmrc/clfor/cfstaff/matw/maproom/RMM/fcsts/m.anom.OLR.uv850.gif
TRMM Rainfall The ENSO Precipitation Index (ESPI) for the last 30 days is -0.4 (mod-strong La Nina below -1) http://trmm.gsfc.nasa.gov/trmm_rain/Events/thirty_day.html http://trmm.gsfc.nasa.gov/trmm_rain/Events/thirty_day.html http://trmm.gsfc.nasa.gov/trmm_rain/Events/thirty_day.html
NOAA subsurface temperatures http://www.cpc.noaa.gov/products/analysis_monitoring/enso_update/sstxz.gif
NOAA Sea Level Anomalies http://www.cpc.noaa.gov/products/analysis_monitoring/enso_update/sealev.gif
TAO array equatorial SSTs and zonal winds http://www.pmel.noaa.gov/tao/jsdisplay/
NIWA SOI 1- and 3-month means January 2008 SOI: 1m 1.5, 3m 1.3 (estimated)
EL NIÑO/SOUTHERN OSCILLATION (ENSO)DIAGNOSTIC DISCUSSION issued by CLIMATE PREDICTION 10 January 2008 Synopsis: La Niña is expected to continue into Northern Hemisphere spring 2008. La Niña remained at moderate strength during December 2007, with below-average sea surface temperatures (SSTs) extending from 160ºE to the South American coast (Fig. 1). All of the Niño region indices remained cooler than −1.0°C (Fig. 2), with the Niño-3.4 and Niño-3 indices persisting near −1.5°C. The upper-ocean heat content (average temperatures in the upper 300 m of the ocean) in the central and east-central equatorial Pacific remained below average (Fig. 3), with temperatures ranging from 2°C to 5°C below average at thermocline depth (Fig. 4). Consistent with these oceanic conditions, stronger-than-average low-level easterly winds and upper-level westerly winds continued across the central equatorial Pacific, convection remained suppressed throughout the central equatorial Pacific, and slightly enhanced convection covered the far western Pacific. Collectively, these oceanic and atmospheric conditions reflect a mature La Niña. The recent SST forecasts (dynamical and statistical models) for the Niño 3.4 region indicate a continuation of La Niña conditions into Northern Hemisphere spring 2008 (Fig. 5). Over half of the models predict a moderate strength La Niña to continue through February-April, followed by weaker La Niña conditions. Current atmospheric and oceanic conditions and recent trends are consistent with a likely continuation of La Niña into the Northern Hemisphere spring 2008. Expected La Niña impacts during January-March include a continuation of above-average precipitation over Indonesia and below-average precipitation over the central and eastern equatorial Pacific. For the contiguous United States, potential impacts include above-average precipitation in the Northern Rockies, the Pacific Northwest, the Ohio and Tennessee Valleys, and parts of the Great Lakes region. Below-average precipitation is expected across the South, particularly in the southeastern states. Recent Madden-Julian Oscillation (MJO) activity has contributed to short-term fluctuations in low-level winds and convection over the equatorial Pacific, which has acted to modify some of the typical La Niña impacts on a sub-seasonal timescale. http://www.noaanews.noaa.gov/stories2007/s2805.htm
Weekly Tropical Climate Note Tuesday 22 January 2008 El Nino-Southern Oscillation Update The 30-day Southern Oscillation Index [SOI] to 19 January was +18, with contributing pressure anomalies of -2.9hPa at Darwin and +0.7 at Tahiti. The official monthly SOI for December was +14, and its 5-month running mean centred on October was +7. El Nino - Southern Oscillation [ENSO] indicators continue to show that La Nina characteristics are well established. Over the past several months, cloudiness around the near-equatorial dateline and further east in the Pacific has mostly been less than normal, corresponding to cooler than average sea-surface temperatures [SST] of that region. Cool anomalies in subsurface water of the near-equatorial eastern and central Pacific have existed for much of the year and persist. Trade-winds in the near-equatorial Pacific have generally been stronger than normal and the Maritime Continent region [including tropical north-Australia] has seen above average cloudiness. Over recent months the SOI has generally been on a rising trend and has been positive since August and around one standard deviation or more above the long-term mean since middle November. The SST about waters to the north and northwest of Australia's coast rose to be warmer than normal for much of December, though the recent vigorous monsoon event has been followed by [probably temporary] cooling. See the Bureau's "ENSO Wrap-Up" at www.bom.gov.au/climate/enso/ which includes a compilation of ENSO dynamic model predictions. Most model guidance is consistent in suggesting continuation of La Nina conditions throughout the southern hemisphere summer months. Intra-Seasonal PatternsFrom early June to mid-October four active phases of the Madden-Julian Oscillation [MJO] were observed to develop over the tropical Indian Ocean. The two most recent of these both progressed rapidly across the Indian Ocean, then lingered over the longitudes of the Maritime Continent and western Pacific. Convective activity increased over the central Indian Ocean around early December, associated with a renewed active MJO phase in that region, continuing the apparent periodicity displayed in recent months of about 40-50 days. The previous two events propagated relatively quickly across the Indian Ocean, however during the recent event broadscale active convection persisted over the Indian Ocean longer. Nonetheless, active convection was a feature of the maritime continent region through the final week of December. Deep monsoon westerlies were first apparent at Darwin from 27 December as the monsoon trough moved onshore there and intensified. For the past two weeks or so, tropical convection has been predominately focussed around the western Pacific, in a similar manner to the previous two MJO events that saw the active MJO phase linger over this region for an extended period, perhaps consistent with existing La Nina conditions. This activity is likely to wane in this part of the globe as the focus of tropical weather activity shifts to the western and central Indian Ocean over the next week or so, before shifting further towards northern Australia later. As a consequence, tropical weather activity over much of northern Australia is likely to be less than the season average until it is reinvigorated by this renewed active phase of the MJO about one to two weeks into February. http://www.bom.gov.au/climate/tropnote/tropnote.shtml
Summary of main seasonal ENSO model results Summary of main seasonal ENSO model results Dynamical Dynamical Statistical Statistical Individual forecasts on following pages, in the above order Individual forecasts on following pages, in the above order Loosely Adapted from http://www.bom.gov.au/climate/ahead/ENSO-summary.shtml Loosely Adapted from http://www.bom.gov.au/climate/ahead/ENSO-summary.shtml
IRI ENSO Forecast Summary ENSO Update: 16 January 2008 Summary La Niña conditions continue in the central and eastern equatorial Pacific. Below-average sea surface temperatures (SSTs) exist from the west coast of South America to west of the dateline. Based on the latest observations and forecasts, there is a 96% probability of maintaining La Niña conditions over the coming season. General Discussion The state of the tropical Pacific remains largely unchanged over the past month. La Niña conditions, which have been in place since August 2007, are indicated by substantially below-average sea surface temperatures in the central and eastern equatorial Pacific, enhanced Trade Winds, and reduced equatorial heat content. The sea surface temperature anomalies are below -2 C throughout much of the eastern-central equatorial Pacific. Strong and very persistent easterly anomalies of the low-level winds extend across most of the equatorial Pacific. Persistence of La Niña conditions is highly likely through at least the next couple months given the current magnitude and spatial extent of the oceanic temperature anomalies. Out of a large set of dynamical and statistical forecast models, most models indicate continuation, but gradual weakening, of the moderately strong La Niña conditions through early 2008. Overall, based on model forecasts and current observations of the ocean surface and subsurface, the probability of a La Niña is estimated at 96% for the Jan-Feb-Mar season in progress. The probability of returning to ENSO-neutral conditions increases to the climatological value of 50%, by mid-2008. http://iri.columbia.edu/climate/ENSO/currentinfo/SST_table.html
Selected ENSO (NINO 3.4 region) forecasts Red=latest runs Blue=previous runs BMRC NCEP UKMO NASA ECMWF