Download
1 / 10
100 likes | 207 Views
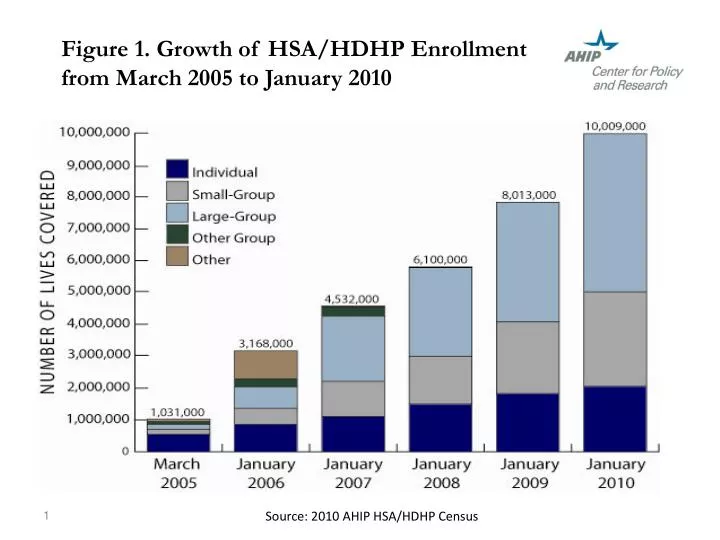
Figure 1. Growth of HSA/HDHP Enrollment from March 2005 to January 2010. Source: 2010 AHIP HSA/HDHP Census. Table 1. HSA/HDHP Enrollment (Covered Lives).

E N D
Figure 1. Growth of HSA/HDHP Enrollment from March 2005 to January 2010 Source: 2010 AHIP HSA/HDHP Census
Table 1. HSA/HDHP Enrollment (Covered Lives) [1] The “Other Group” category includes companies that were able to provide numbers of lives covered by group policies, but could not break out these numbers by either small or large groups. [2] The “Other” category includes companies that were able to provide information on the number of lives covered by an HSA/HDHP, but were not able to provide a breakdown by market. Sources: 2005-2010 AHIP HSA/HDHP Census Reports
Table 2. HSA/HDHP Enrollment Levels, by Number of Responding Companies Sources: 2005-2010 AHIP HSA/HDHP Census Reports
Figure 2. Percentage of Lives Covered by HSA/HDHPs, by Market Type Note -- Covered lives for "other" and "other group" categories are not included in these calculations. Sources: 2005-2010 AHIP HSA/HDHP Census Reports
Figure 3. Age Distribution of People Covered by HSA/HDHPs Individual Market Source: 2010 AHIP HSA/HDHP Census
Table 3. Description of HSA/HDHP Policies, Individual Market – Best-Selling Product Source: 2010 AHIP HSA/HDHP Census
Table 4. Individual HSA/HDHP Premiums, by Age– Best-Selling Product Source: 2010 AHIP HSA/HDHP Census
Table 5. Description of HSA/HDHP Policies, Small-Group Market – Best-Selling Product Source: 2010 AHIP HSA/HDHP Census
Table 6. Description of HSA/HDHP Policies, Large-Group Market – Best-Selling Product Source: 2010 AHIP HSA/HDHP Census
Table 7. Total Enrollment in HSA/HDHP Plans and Estimated HSA/HDHP Enrollment as a Percentage of Total Enrollment in Private Health Insurance, by State, January 2010 Sources: AHIP Census January 2010. US Census Bureau Current Population Survey (CPS), Annual Social and Economic Supplement 2008.