Download
1 / 24
240 likes | 333 Views
Display of Data. Vector Symbology. Display of Data. Vector Symbology Labeling. Display of Data. Vector Symbology Labeling Raster Color Palettes. Display of Data. Vector Symbology Labeling Raster Color Palettes Contrast Enhancements. Map Making. ArcMap Layout View.

E N D
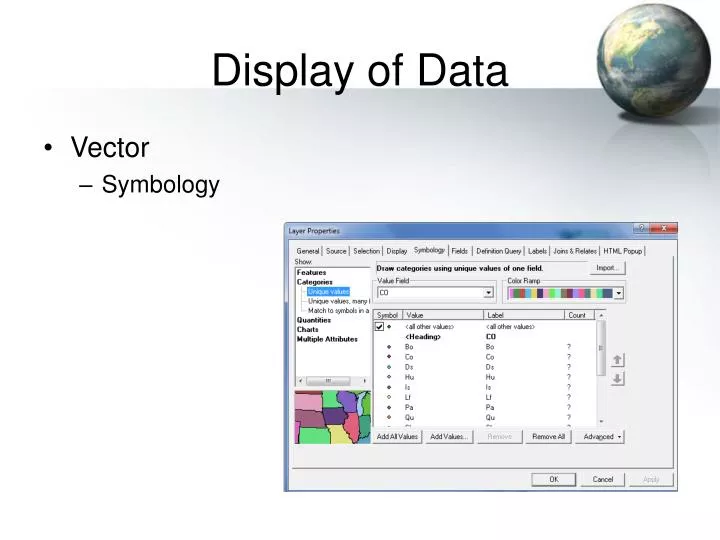
Display of Data • Vector • Symbology
Display of Data • Vector • Symbology • Labeling
Display of Data • Vector • Symbology • Labeling • Raster • Color Palettes
Display of Data • Vector • Symbology • Labeling • Raster • Color Palettes • Contrast Enhancements
Map Making • ArcMap Layout View
Sources of Data • USGS http://eros.usgs.gov/#/Find_Data
Sources of Data • State (Ex. MARIS http://www.maris.state.ms.us/home.htm)
Sources of Data • GIS Data Deopt (http://data.geocomm.com/catalog/index.html)
Projections • Models for representing the shape of the Earth
Projections • Mercator
Projections • Transverse Mercator
Projections • Universal Transverse Mercator
Projections • Universal Transverse Mercator
Projections • Local Variations Mississippi Transverse Mercator System (MSTM)
Projections • State Plane
Projections • Datums: NAD83, NAD27
Projections • Datums: NAD83, NAD27 • Geoids: Clark1866, GRS80, WGS84
Projections • ArcMap: Define Projection
Projections • ArcMap: Project on the Fly!
Adding Your Own Data • Vector • Add X,Y Data
Adding Your Own Data • Vector • Add X,Y Data • Geocorrection (Spatial Adjustment)
Adding Your Own Data • Vector • Add X,Y Data • Geocorrection (Spatial Adjustment) • Raster • Georeferencing
Example: Hollywood • Georeference old site map (raster) • Add my excavation units from 2011 (vector)