Download
1 / 29
290 likes | 297 Views
Visual Algebra for Teachers. Activity Set 3.1 PREP PPTX. Visual Algebra for Teachers. Chapter 3 REAL NUMBERS AND QUADRATIC FUNCTIONS. Visual Algebra for Teachers. Activity Set 3.1. Graphing with Real Numbers. PURPOSE. To learn:

E N D
Visual Algebra for Teachers Activity Set 3.1 PREP PPTX
Visual Algebra for Teachers Chapter 3 REAL NUMBERS AND QUADRATIC FUNCTIONS
Visual Algebra for Teachers Activity Set 3.1 Graphing with Real Numbers
PURPOSE • To learn: • How to extend the idea of working with discrete data points (individual tile figures) to working symbolically and graphically with real number function inputs and outputs. • How to find the domain and range of basic functions. • How to describe domains and ranges using number line and inequality notation. • About absolute value tile sequences and their corresponding symbolic and graphical forms.
MATERIALS Black and red tiles
Domain of a Function The Domain of a Function is the set of allowable inputs for a function. We used a domain of the counting numbers (n = 1, 2, 3 …) to describe the input set (figure numbers) for Activity Sets 2.1 through 2.4. In Activity Set 2.5 we extended our domain to the set of Integers and considered all of the tile figures corresponding to input numbers n = 0, ±1, ±2 …
Range of a Function The Range of a Function is the set of possible outputs for the function. We have seen many possible ranges. For example, for the function with n = 1, 2, 3 … our range is the set of numbers 3, 5, 7… (why?) For the function with n = 1, 2, 3 … our range is the set of numbers -2, -4, -6 …(again, why?).
Real numbers The set of Real Numbers (R) is the set of all of the numbers on the number line and is the union of all of the rational numbers (Q for quotient) and irrational numbers (I): R = QI. Rational Numbers(Q) are the numbers that can be written as a ratio of two integers with a nonzero denominator. Irrational Numbers(I) are the numbers, such as that can not be written as a ratio of two integers.
“All” of the Points Graphing and Modeling “All” of the Points In Chapter 2, we plotted distinct (discrete) coordinate pairs corresponding to functions defined with figure number inputs and net value outputs. In many cases, it probably felt natural to “connect the dots” even though there were no figures corresponding to input numbers such as 0.5 and -2.1.
“All” of the Points Graphing and Modeling “All” of the Points You may have also noticed that even though there were no figures corresponding to such numbers, symbolically, it did make sense to use numbers other than n = 1, 2, 3 … or n = 0, ±1, ±2 … as function inputs (as the function domain).
“All” of the Points We will now extend our working domains and ranges to the real numbers and subsets of the real numbers so that we may, in fact, “connect the dots” and graph all of the points. In some cases, we will be able to sketch actual figures that correspond to rational number inputs such as 1/2 and 1/3. Of course, we won’t be able to physically model these figures unless we break up our algebra pieces, but we can sketch pictures of partial tiles.
“All” of the Points Overall, we will use extended tile figure sequences to find patterns and then use the symbolic function rules we find to determine additional coordinate pair points on our function graphs. We can then precisely “connect the dots” and complete our graphs.
Using x and y Using x as the Independent Variable and y as the Dependent Variable We will now use x for the independent input variable and y as the dependent output variable We will do this to help us keep track of our change to using real numbers. For functions we will use x and y notation such as y = f(x) (instead of T = f(n)).
Using x and y with strips We will call our white strips “white and opposite white x-strips” instead of “white and opposite white n-strips” and we will label the strips with x and –x instead of n and –n. We will start using white and opposite white x-strips in Activity Set 3.2.
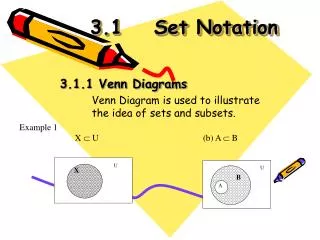
Real Number Display Examples Showing and Describing Real Numbers and Subsets of Real Numbers In order to answer questions about domain and range, we will need to be able to describe subsets of the real numbers. The two ways we will use to do this are: Using a Number Line (visual) Using Inequality Notation (symbolic) We will not use Interval Notation such as (-2, 7) [for the interval -2 < x < 7]. This notation does not indicate a variable and an interval such as (-2, 7) is easily confused with a coordinate pair.
Example 1—All real numbers (R) - < x < + Read as “All x greater than negative infinity and less than positive infinity”
Ex 2—All R greater than 0 0 < y < , 0 < y or y > 0 Read as “All y greater than 0”
Ex 3: R greater than or equal to -1 and less than 3 -1 x < 3 Read as “All x greater than or equal to -1 and less than 3”
Ex 4: R less than -2 or greater than or equal to 0 y < -2 or y 0 (both pieces are needed here) Read as “All y less than -2 or greater or equal to 0”
PREP Questions #1abc • Write in your coursepack, Activity Set 3.1 #1 • Refer to “Showing and Describing Real Numbers and Subsets of Real Numbers” in the Introduction to answer these questions: • On a number line: What does an open circle around a number mean? What does the solid circle mean? • What words correspond to the symbols < and > ? • What words correspond to the symbols ≤ and ≥ ?
PREP Question #2a Write in your coursepack, Activity Set 3.1 #2 Analyze the following extended sequence of tile figures y = f(x), with domain, R and a. Sketch figures corresponding to x = 1.5 and x = 3.1
PREP Question #2b Write in your coursepack, Activity Set 3.1 #2 b. Fill out the indicated function values in the following t-table.
PREP Question #2c Write in your coursepack, Activity Set 3.1 #2 c. Look at the symbolic form of the function y = f(x) What possible output values do you think you can obtain, i.e., what is the range of y = f(x)? Give this range on a number line Give this range using inequality notation.
PREP Question #2d Write in your coursepack, Activity Set 3.1 #2 d Label the axes with appropriate numbers, plot enough coordinate pairs on the following grid so that you can connect the points and sketch the function f(x). Because we are using the real numbers, R, as our domain, the function will fill in between the plotted points and continues in both directions (even though the grid ends). You can show the idea of “continuing on” by sketching arrows on each end of your function sketch
PREP Question #2e Write in your coursepack, Activity Set 3.1 #2 e. How does your answer for part c. about range (of f(x)) show visually on the graph (of f(x)) in part d.? Explain the connection
PREP Question #3 Write in your coursepack, Activity Set 3.1 #3 What is the domain (the set of allowable inputs) of a function of the form y = mx + b where m, b R? How does this show visually on the graph of y = mx + b?
PREP Question #4 Write in your coursepack, Activity Set 3.1 #4 What is the range (set of possible outputs) of a function of the form y = mx + b where m, b R? Are there any special cases? (Think about all the lines you can draw) How does this show visually on the graph of y = mx + b?
Visual Algebra for Teachers You are now ready for: PREP QUIZ 3.1 See Moodle