Download

1 / 26
260 likes | 305 Views
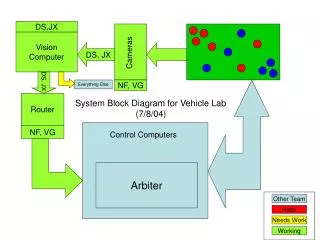
Computer Vision. Hough Transform, PDM, ASM and AAM David Pycock D.Pycock@bham.ac.uk www.bham.ac.uk/pycockd. Image Edge detected image. Hough Transform. To detect lines, circles, ellipses and other forms of curve

E N D
Computer Vision Hough Transform, PDM, ASM and AAM David Pycock D.Pycock@bham.ac.uk www.bham.ac.uk/pycockd
Image Edge detected image Hough Transform • To detect lines, circles, ellipses and other forms of curve • Use a parametric representation to determine how edges can be combined into a curve
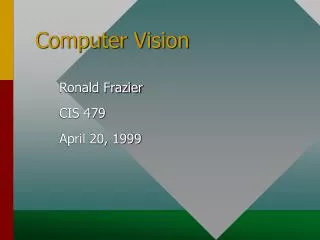
y=mx+c D q C B r q A O r=OB + BC OB=OA/cosq BC=DB sinq DB=y-AB=y-OA tanq OA=x Thus r=x/cosq +(y-xtanq)sinq Re-arranging: r cosq = x(1-sin2q) + ysinq cosq Since 1= cos2q + sin2q r cosq = xcos2q + ysinq cosq i.e.r = xcosq + ysinq
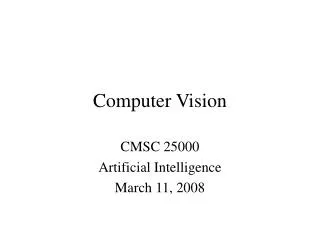
r q A single point in x-y coordinate space transforms into a sine wave in r-q or Hough space The intersection of the sine waves represents a line
The Hough space is an accumulator • The dimensions is equal to the number of parameters in the parametric equation • The number of bins in r and q is critical • Too few and the resolution is poor • Too many and the accumulator is large and peaks difficult to detect Clear accumulator For each point (x, y) in image increment corresponding counts in accumulator Locate maxima in accumulator
Hough Transform for Circles • Equation of a circle radius r and centre (a, b) is: r2 = (x-a)2 + (y-b)2 • Accumulator is 3 dimensional in (a, b, r)
16 grey-levels Model-Based Interpretation: Finding the Boundary of Skin Cells A robust and adaptable model based scheme: • normalised features • multiple boundary models • statistical interpretation process
b i-1 v i b int i I i ext I r i i v i 1 + b i+1 Definition of Boundary Similarity Features Feature measures for: roundness curvature grey-level pattern near boundary edge strength and direction Similarity features a with invariance properties, e.g.: Radial similarity: , Grey level similarity and Assuming . The set of normalised features for each boundary point is where is the feature index.
start: i=1 start: i=1 j j i i features associated with Overview of Interpretation Strategy Boundary selection process Boundary cue generation process Compute candidate point features and interpret using models Select candidate points to form boundary Match detected boundaries to models
Cell Segmentation Results
Point Distribution Model(Hlavac, Soka & Boyle p464 ff) • Select as landmarks points that canreadily be identified and that arealways in the same place • E.g. Finger tips, bottom of fingers and midway between • Need to align the data so that shape variation is characterised • Align all examples by rotating translating and scaling to mean squared error between landmarks
Alignment algorithm • Rotate, scale and translate each vector (xi) with the the first vector (x1)to give the set: • Repeat • Calculate the mean and covariance of the transformed shapes • Rotate, scale and translate the mean shape to align with (x1) • Rotate, scale, translateto match the adjusted mean • Until mean converges • This process avoids an arbitrary bias due to the selection of the first vector
The variance about this mean is characterised by the covariance matrix, S: • The model is the means shape vector: • Characterise the variations of the covariance matrix in reduced dimensionality • Identify the Principal Components of this covariance matrix to find the i of: Spi= ipi Where S is the covariance matrix i the eigenvalues and pi the eigenvectors
The eigenvectors of S are a basis that can be combined to explain the variation represented by S. • Thus individual variations modelled by S can be computed using: • Not all the eigenvectors will be needed • Most of the population will be within 3s of the the population mean thus:
Fitting Models to Data • This is done to obtain an interpretation inn which the model projects a boundary interpretation onto a set of landmarks from an image • Using the PDM model instances are translated rotated and scaled and the instance with the best match to the data is selected. • This is can be a slow process.
Active Shape Model • This is a variation to the way that a model is matched to the data • The process is: • Find an approximate match of model to data • Repeat • At each landmark search normal to the boundary and make point with greatest gradient new landmark • Adjust pose of the model to better fit data • Compute the displacement vector for each landmark to this new model instantiation • Find the best model perturbation using: • Until change of model is small
Active Appearance Models • Adds grey-level modelling to geometric modelling • Grey-level and geometric models are separated to reduce the search space • Normalise grey-levels around each landmark • Common to sample grey levels in a spiral around a 5 x 5 region.
Active Appearance Modelling • Warp each image to the mean shape (linear or non-linear) • Normalize each image to the average grey-level and unit variance • Perform PCA to extract grey-level eigenvectors • Represent each intensity sample as a linear combination ofgrey-level eigenvectors: • Compute ASM & approximate each shape using: • Apply PCA and compute overall eigenvector model:
Active Appearance Model Interpretation • Require a similarity or affine transform for: • Global intensity parameters • Appearance coefficients • Match in image space • Early approach used reduced rank multivariate analysis • Current approach uses a Taylor series expansion, which is: • Easier to implement • Faster to calculate • Requires less memory • Produces comparable or better results
Let: • t be the parameters of the geometric transformation, T, of the modelc be the transformation coefficients for the grey level modelu be the the global intensity coefficients for transformation of the model to an instance is an estimate of the parameter vector p and p*is the optimal value of • Overview of technique • The model parameters, t, c and u are randomly perturbed (with constraints) and the residual: r(p)=gs(p)-gm(p) computed, where pT = (cT|tT|uT). • The first order Taylor expansion at is:
The Jacobian matrix is: Where M is the number of model parameters N is the number of components • The update parameter , The aim is to make the update parameter zero. • A least squares solution of the Taylor series expansion gives: • This is in effect the gradient of the image difference objective (or image match) function
A simplified approximation,possible because AAM’s work in astandardized reference frame, is: • The rhs of the above can be considered a constant and calculated once per match process. • The kth perturbation of parameter ej, the jth column of the Jacobian can be estimated as: • The kernel w(.) can be Gaussian
AAM Matching Algorithm • Place an appearance model approximately on the object using the parameters c, t, y and compute the difference image gs-gm • Repeat • Compute the RMS of the difference image, E(r) = ||r||2 • Repeat • Compute the model corrections dp = -R(gs-gm) • Set k=1 • Repeat • Recompute model parameters: c=c-kdc, t=t-kdt and u=u-kdu • Recompute the image difference: gs-gm • Recompute the RMS of the difference E(r) = ||r||2 • If (E(r) ≥E) update k /1.5, 0.5. 0.25/ • While ((E(r) ≥E) AND (E(r) has not converged)) • If (E(r) <E) accept c, t and u • While (E(r) ≥E)
Extensions • Time Series • Volume Data • AAM DemoDownload from: www2.imm.dtu.dk/~aam
Key References PDM Cootes TF and Taylor CJ, Active shape models – “smart snakes”, In Proceedings of the British Machine Vision Conference, (Ed. Hogg, DC), Leeds, UK, pp266-275, 1992 AAM Cootes TF, Edwards GJ and Taylor CJ, Active appearance models, IEEE Trans. Patt. Anal. Mach. Intell., 23, pp 681-685, 2001