Download
1 / 68
680 likes | 814 Views
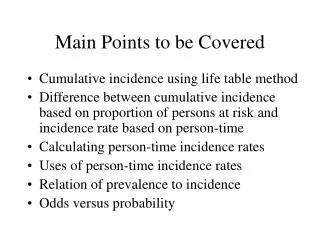
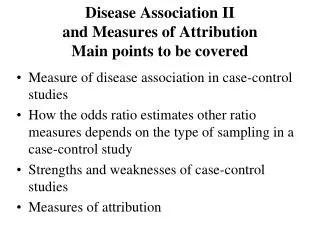
Disease Association II Main points to be covered Fall 2010. Measure of disease association in case-control studies How the odds ratio estimates other ratio measures depends on the type of sampling in a case-control study Strengths and weaknesses of case-control studies

E N D
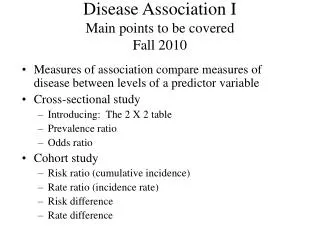
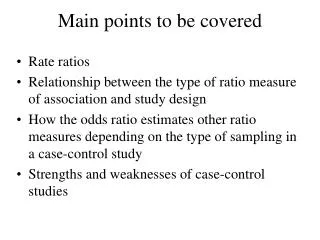
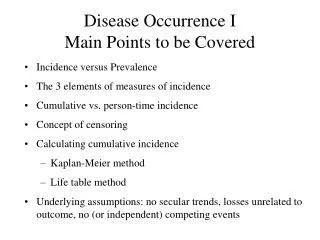
Disease Association IIMain points to be coveredFall 2010 • Measure of disease association in case-control studies • How the odds ratio estimates other ratio measures depends on the type of sampling in a case-control study • Strengths and weaknesses of case-control studies • Relationship between study design and the type of ratio measure of association available
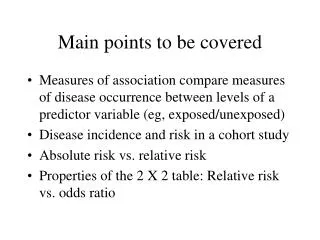
How to measure disease association in case-control design? • In cohort study, we compare the occurrence of disease in exposed and unexposed • Most intuitive approach to evaluating causation • In case-control, we can’t do this
What can we estimate? Case-Control study of TZD use & fracture in diabetes. [TZD = Thiazolidinedione, a class of diabetes meds] Study with 3-4 controls per case. What happens if we try to estimate incidence or odds of fracture in either exposure group? Meier et al. Arch Intern Med 2008
Can’t estimate odds of event by exposure status Case-Control study of TZD use & fracture in diabetes (1994-2005) – WITH 3-4 CONTROLS PER CASE Odds of a fracture in TZD users are 1:3 (over 10 years). Seems high but we can make it even higher…
Can’t estimate odds of event by exposure status Case-Control study of TZD use & fracture in diabetes (1994-2005) – REDUCE CONTROLS BY 50% Now the calculated odds of a fracture in TZD users are about 1:1.5. Just an example of why the odds of disease can’t be estimated in a case-control design.
What can we estimate? Case-Control study of TZD use & fracture in diabetes. If we try to estimate incidence or odds of fracture in either exposure group, the result is nonsense. It depends on whether the study selected 4 controls per case, or 2 controls per case, etc. Meier et al. Arch Intern Med 2008
Measure of Association in Case-Control Studies • Can’t measure disease occurrence (risk, rate, or odds) in case-control design so can’t form a measure of disease association based on disease occurrence • We can measure the OR of exposure. Not what we want - but we can take advantage of mathematical properties of odds ratio to obtain our desired measure - OR of disease.
Measure of Association in Case-Control Studies • A useful property of OR: OR of exposure = OR of disease • Use Odds ratio (OR)of exposure in cases and controls as the measure of association
Important Property of Odds Ratio #4 • The odds ratio of disease in the exposed and unexposed equals the odds ratio of exposure in the diseased (cases) and controls
Odds ratio of exposure in diseased and not diseased Disease a Yes No a + c Odds of E in D = a b a Yes 1 - a + c Exposure b d Odds of E in not D = c b + d No b 1 - b + d a + c b + d
Odds ratio of exposure in diseased and not diseased Disease a Yes No a + c Odds of E in D = a b c Yes a + c Exposure b d Odds of E in not D = c b + d No d b + d a + c b + d
Odds ratio of exposure in diseased and not diseased Disease Yes No a a b Yes c ORexp = Exposure b d c No d a + c b + d
a c b d Important characteristic of odds ratio ad bc ORexp = = We demonstrated last week that ORdis also equals a*d/b*c. OR for exposure = OR for disease Cross-product is convenient for calculation, but, to avoid confusion, best to think of this as calculated from the odds.
What the OR in a case control study estimates OR of exposure estimates different measures of association depending on the type of sampling for controls
To understand what OR in a case-control study estimates, we return to the setting of a cohort Some abbreviations: 1= exposed and 0 = not exposed E1 = Events = diagnoses in exposed group E0 = Events = diagnoses in unexposed group N1 = number of persons in exposed group (at BL) N0 = number of persons in unexposed group (at BL)
Case-control Design • To switch from the notation of a cohort to case-control design, the events (diagnoses) in a case-control study are the cases • Some of the cases will be discovered to have been exposed = E1 • And some of the cases will be discovered to have been unexposed = E0
Risk ratio in a cohort study Risk ratio = So if you have the cases, Only need the ratio from a case-control study to estimate risk ratio.
Capturing the events with a case-control design • From a well-defined study base: • All new cases in the study base will be the same cases as in a cohort study of the base (E1 and E0 ) • Or a random sample of the cases will also give the same ratio
Sampling in a case-control study • If the goal is to obtain the risk ratio and you have all the cases (or a random sample), you need to sample the study base to get an unbiased estimate of the exposure distribution in the controls • The exposure distribution in the controls is given by the ratio • Thus if this ratio can be obtained in a case-control study, the risk ratio is obtained with a case-control design
Case Control Sampling and the Risk Ratio • How can the study base be sampled to get an unbiased estimate of the risk ratio? • Question can be rephrased as “How can the study base be sampled to get an unbiased estimate of?”
Three Case-Control Designs 1) Case-cohort design: controls sampled from baseline of the underlying cohort 2) Incidence-density controls: controls sampled from risk sets of underlying cohort each time a case is diagnosed 3) Prevalent controls: controls sampled from non-cases at one point in time during follow-up of the underlying cohort
Case-cohort: sample baseline of cohort N0 / N1 is sampled randomly from baseline E1 E0 N0 N1
How OR = Risk ratio in a Case-Cohort design • k=sampling probability • of baseline • OR = a/c = • b/d • E1 • E0 • N1 • N0 Cases Controls a = E1 b ≈ k×N1 Yes Exposure c = E0 d ≈ k×N0 No
Risk ratio in a cohort study Risk ratio = So if you have the cases, Only need the ratio
Case-cohort Sampling • Control (reference) group is random sample of cohort at baseline • Estimates the odds of exposure in the study base (i.e., estimates N0 / N1) • Control group can be used for >1 outcome • Can use same controls later for more follow-up or other outcome • Relatively new design: first described by Prentice (1986) • Odds ratio estimates the risk ratio
Example of case-cohort study In the Netherlands Cohort Study among 120,852 subjects aged 55-69 years at baseline (1986), the association between vitamins and carotenoids intake, vitamin supplement use, and bladder cancer incidence was examined. . . . After 6.3 years of follow-up, data from 569 cases and 3123 subcohort members were available for case-cohort analyses. The age-, sex-, and smoking-adjusted relative risks (RRs) for retinol, vitamin E, folate, a-carotene, b-carotene, lutein and zeaxanthin, and lycopene were 1.04, 0.98, 1.03, 0.99, 1.16, 1.11, and 1.08, respectively, comparing highest to lowest quintile of intake. Only vitamin C (RR: 0.81, 95% CI: 0.61-1.07, P-trend = 0.08), and b-cryptoxanthin intake (RR: 0.74, 95% CI: 0.53-1.03, P-trend = 0.01) were inversely associated with bladder cancer risk. Zeegers MP, Goldbohm RA, Brandt PA. Are retinol, vitamin C, vitamin E, folate and carotenoids intake associated with bladder cancer risk? Results from the Netherlands Cohort Study. Br J Cancer 2001 Sep;85(7):977-83
Another Example of Case-Cohort Study: Serum 25 HydroxyVitamin D and the Risk of Hip and Non-spine Fractures in Older Men The present study is a case-cohort study nested within the prospective design of MrOS. Men without sufficient serum for vitamin D assays were excluded from all analyses. Of the 5,908 eligible participants, we randomly selected 1608 men to serve as the sub-cohort. In this subcohort, two participants were excluded: one participant with insufficient serum, and another who had 25(OH) vitamin D levels >3 SD above the mean (75.6 ng/ml). The resulting 1606 men constituted the subcohort for this study (15). We observed 435 incident non spine fracture cases (including 81 hip fractures) in the entire cohort over the 5.3 years of follow-up. Among these cases, 112 individuals were also sampled within the subcohort. Cauley et al. JBMR 2009
Case-cohort within MrOS Cohort Cohort baseline = 5,908 subjects 435 incident cases of non-spine fracture 1608 subjects randomly sampled for blood tests Assays on 1608+435-112 = 1931
Example of Case-Cohort Study: Serum 25 HydroxyVitamin D and the Risk of Hip and Non-spine Fractures in Older Men ABSTRACT To test the hypothesis that low serum 25-hydroxyvitamin D [(25(OH) vitamin D] levels are associated with an increased risk of fracture we performed a case-cohort study of 436 men with incident non-spine fractures including 81 hip fractures and a random subcohort of 1608 men; average follow-up time 5.3 years. Serum 25(OH) vitamin D2 and D3 were measured on baseline sera… Modified Cox proportional hazards models were used to estimate the hazard ratio (HR) of fracture with 95% confidence intervals. …One SD decrease in total 25(OH) vitamin D was associated with an increased risk of hip fracture (multivariate HR=1.60 (1.18-2.17)... Cauley et al. JBMR 2009
Some practical concerns in case-cohort design • What % of baseline have serum (or image, etc.) archived? • Are data missing randomly? • Were particular groups over-sampled in previous case-control studies?
Estimating the rate ratio in a case-control study • For calculating a rate ratio, what is analogous to estimating the proportion of exposed and unexposed persons in obtaining a risk ratio? • Answer: the proportion of exposed and unexposed person-time
Rate ratio in cohort where = exposed and = unexposed person-time Rate Ratio = So analogous to estimating risk ratio, we need to estimate the proportion If we can estimate that proportion in a case- control study, we can estimate the rate ratio
Second type of case-control sampling Incidence density sampling • Controls are sampled from the risk set at the time each case is diagnosed • Samples person-time experience of the subjects at risk each time a case is diagnosed • Odds ratio estimates the rate ratio
Incidence density sampling in a fixed cohort study base • Controls are matched to cases on time at risk (same amount of follow-up time) • Sampling non-cases at each time case occurs samples person-time • Someone who is a control at one time can later be a case and/or a control again
Incidence density sampling within a fixed cohort Since controls are matched on follow-up time, sampling controls each time a case occurs samples the person-time of the cohort up to that point. So the total person-time of follow-up is sampled with this design.
Incidence density sampling in a dynamic cohort (e.g., Kaiser Permanente membership) New members D Sampling in a dynamic cohort gives unbiased estimate of person-time in the same way as sampling in a closed cohort
Incidence density sampling • Individual can be sampled as a control more than once • Individual sampled as a control can be a case later
How OR = Rate ratio in a case-control study with incidence density sampling k=sampling probability of person-time So OR = a/c = b/d E1 E0 N1T1 N0T0 Controls Cases a = E1 Yes b ≈k×N1 T1 Exposure c = E0 d ≈k×N0T0 No
Rate ratio in cohort where = exposed and = unexposed person-time Rate Ratio = So inverting and multiplying the OR on the previous slide gives the right-hand term on this slide (the sampling probability k cancels out) = left-hand term, the rate ratio.
Case-control incidence density sampling ...In a population-based case-control study in Germany, the authors determined the effect of alcohol consumption at low-to-moderate levels on breast cancer risk among women up to age 50 years. The study included 706 case women whose breast cancer had been newly diagnosed in 1992-1995 and 1,381controls matched on date, age, and residence. In multivariate conditional logistic regression analysis, the adjusted odds ratios for breast cancer were 0.71 (95% confidence interval (CI): 0.54, 0.91) for average ethanol intake of 1-5 g/day, 0.67 (95% CI: 0.50, 0.91) for intake of 6-11 g/day, 0.73 (95% CI: 0.51, 1.05) for 12-18 g/day, 1.10 (95% CI: 0.73, 1.65) for 19-30 g/day, and 1.94 (95% CI: 1.18, 3.20) for > or = 31 g/day. . . These data suggest that low-level consumption of alcohol does not increase breast cancer risk in premenopausal women. Kropp, S; Becher, H; Nieters, A; Chang-Claude, J. Low-to-moderate alcohol consumption and breast cancer risk by age 50 years among women in Germany. Am J Epidemiol 2001 Oct 1, 154(7):624-34.
Selection of cases and controls • Subjects eligible for participation were German-speaking women with no former history of breast cancer who resided in one of two geographic areas in southern Germany. We attempted to recruit all patients who were under 51 years of age at the time of diagnosis of incident in-situ or invasive breast cancer. We compiled cases diagnosed between January 1, 1992, and December 31, 1995, in the Rhein-Neckar-Odenwald study region and between January 1, 1993, and December 31, 1995, in the Freiburg study region, by surveying 38 hospitals that serve the populations of these two regions. • Controls were selected from random lists of residents supplied by the population registries.For every recruited patient, two controls matched according to exact age and study region were immediately contacted by letter. • There were 1,020 eligible patients, of whom 1,005 were alive when identified. Of these living case subjects, 706 (70.2 percent) completed the study questionnaire. Among the 2,257 eligible controls, 1,381 (61.2 percent) participated.
Incidence density sampling within a dynamic cohort (German population 1992-1995) New residents D 706 incident cases of breast cancer 1,381 age & residence matched Random sample of population each time breast cancer diagnosed
Risk or rate difference in case control study? • We can obtain an unbiased estimate of the risk ratio or rate ratio in a case control study. Can we calculate a similar unbiased estimate of the risk or rate differences from a case control study? • No. Not possible to calculate a difference. • For an estimate, could use external data for absolute incidence in unexposed. From this, you can apply your case-control derived risk or rate ratio and then get absolute incidence in exposed
Third type of case-control sampling • Sampling only non-cases in a primary or secondary study base • Prevalent controls because controls are sampled from those without disease with a cross-sectional sample of the study base • Odds ratio approximates risk ratio only if disease occurrence is rare
Text example of case-control design showing sampling prevalent controls from non-cases Study Base Only non-cases are eligible to be controls in this design
Inability to calculate unbiased estimate of risk ratio if controls sampled from non-cases ratio is known in all case-control designs But sampling only non-cases at a point in time after all cases have occurred cannot get unbiased estimate of
Inability to calculate risk ratio if controls sampled from non-cases In a hypothetical cohort of 200:
Inability to calculate risk ratio if controls sampled from non-cases • So in this example: • And: • True risk ratio = 4.0
OR using controls from prevalent non-cases Cases Non-cases Disease No disease 40 60 Exposed time No disease Disease Unexposed 10 90 Using all prevalent non-cases in cohort, the OR would be: OR = 40/10 = 6.0 60/90 A random sample of the non-cases would give the same OR. OR is not an unbiased estimate of risk ratio. In this example, with high incidence of disease, OR also not a close approximation of risk ratio.
Case-Control with prevalent controls • If controls are selected among those without disease at time of study (+ prevalent cases), the OR approximates risk ratio only with the rare disease assumption • Rare disease assumption: if disease incidence low in unexposed and exposed (<10%), OR Risk Ratio • Exposure in controls exposure in whole cohort