Download
1 / 20
200 likes | 204 Views
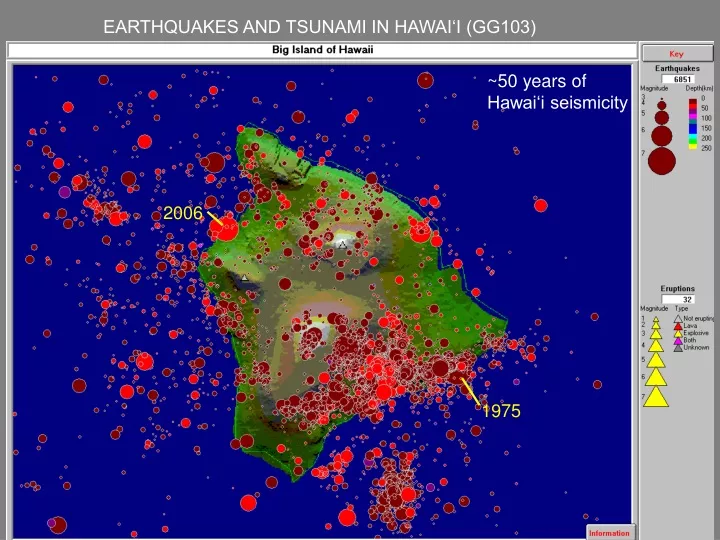
EARTHQUAKES AND TSUNAMI IN HAWAI‘I (GG103). ~50 years of Hawai‘i seismicity. 2006. 1975. D = v x t, Δ D = Δ v x Δ t, but v is constant: 7 km s -1 so Δ D = v x Δ t If an earthquake signal arrives at different times to two different seismometers, you

E N D
EARTHQUAKES AND TSUNAMI IN HAWAI‘I (GG103) ~50 years of Hawai‘i seismicity 2006 1975
D = v x t, ΔD = Δv x Δt, but v is constant: 7 km s-1 so ΔD = v x Δt If an earthquake signal arrives at different times to two different seismometers, you can say how much closer the earthquake was to one seismometer relative to the other. A: earthquake occurs at 00:00:00 GMT B: earthquake occurs at 00:00:30 GMT Δt = 30 s → ΔD = 7 km s-1 x 30 s = 210 km ~200 km All these points are 200 km closer to A than they are to B Map view Map view
…and the plane doesn’t extend up in the air, only into the ground In reality, the earthquake is on a curved plane, not a curved line… The earthquake was somewhere on this curved plane Attempt at perspective view
There is a similar curved surface that can be drawn based on the difference between the arrival times between stations A and C. The earthquake was somewhere on this curved line
The earthquake was somewhere on all three of these curved lines simultaneously, i.e., where they intersect
Examples USGS
Same N-S fault, different slip direction Stein and Wysession, An Introduction to seismology, earthquakes and Earth structure
Energy and Polarity of “First Motions” Cox and Hart. Plate Tectonics – How it works.
Earthquake on a vertical plane Edited from Cox and Hart. Plate Tectonics – How it works.
Determination of nodal planes Cox and Hart. Plate Tectonics – How it works.
Spreading of the seismic wave Cox and Hart. Plate Tectonics – How it works.
Data on the surface, interpreted in 3D Cox and Hart. Plate Tectonics – How it works.
With a lot of recordings we can reconstruct faults with any orientations Cox and Hart. Plate Tectonics – How it works.
Example Focal mechanism diagrams on mid-ocean ridges Stein and Wysession, An Introduction to seismology, earthquakes and Earth structure