Download
1 / 17
170 likes | 218 Views
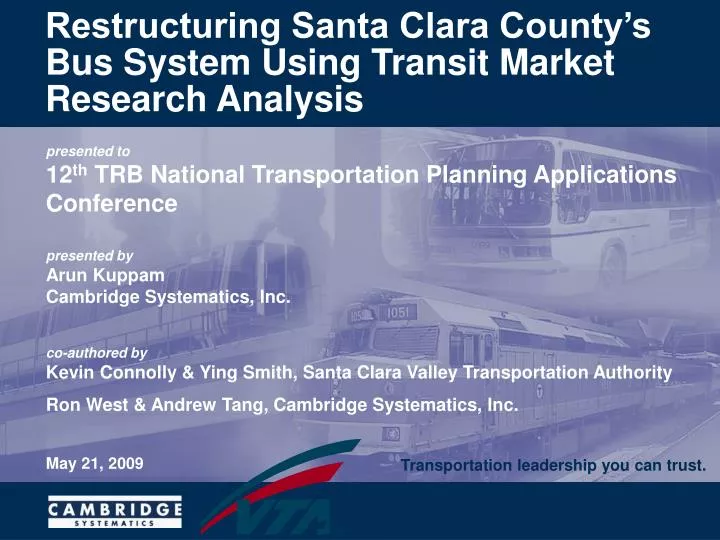
Restructuring Santa Clara County’s Bus System Using Transit Market Research Analysis. Transportation leadership you can trust. presented to 12 th TRB National Transportation Planning Applications Conference presented by Arun Kuppam Cambridge Systematics, Inc.

E N D
Restructuring Santa Clara County’s Bus System Using Transit Market Research Analysis Transportation leadership you can trust. presented to12th TRB National Transportation Planning Applications Conference presented byArun KuppamCambridge Systematics, Inc. co-authored byKevin Connolly & Ying Smith, Santa Clara Valley Transportation Authority Ron West & Andrew Tang, Cambridge Systematics, Inc. May 21, 2009
From Market Research to Service Planning Segment Market Locate Market Segments Competitive Positioning Understand Travel Markets Service Planning Transit Priority CustomerExperience Personal Safety SystemPerformance Real time Info NetworkStructure Market-Based Planning
Market-Based PlanningFrom Data Collection to Modeling to Service Planning Survey Data Collection (819 SP Surveys, 34 attitudinal Q.) Exploratory Factor Analysis Confirmatory Factor Analysis Structural Equation Modeling (7 factors) Market Segmentation (6 segments) Mode Choice Modeling General Segment Specific Tool Development Sketch Planning Tool Transit Competitiveness Index
Attitude-Based Market Research Survey Recruit Survey Choice Experiments AttitudinalQuestions Random Sampling 7,822 Phone Calls 1,001 Recruited 819 Completes Both English and Spanish Trip Information Demographic Data Measure Sensitivity Privacy and Comfort Productive Use of Time Safety and Familiarity Time and Flexibility Concern for the Environment Value of Time Reliability and Control Fixed Schedule Constraints Compare driving and transit options Travel Time Test New Mode: BRT Passenger Amenities Driving Cost and Transit Fare Parking Cost Transfer Access and Egress Understanding Traveler Attitudes
Attitude-Based Survey Results Strongly Agree Neutral Strongly Disagree 34 Attitudinal Statements 1. Public transport helps environment 2. Need to arrive at specific time TOP FIVE 3. Transit takes too long 4. Don’t mind walking to stop 5. I need travel flexibility • Prefer travel in least expensive way • Would ride LRT but not bus • Prefer buses that travel within my community • Transit takes me where I need to go • Transportation reflects social status BOTTOM FIVE
Grouping Statements into Factors Statements Factors Factors 1) Make trips to wide variety of locations 2) Make several stops on the way to school or work 1) Travel Flexibility 3) Need flexibility to make many trips during the day 32) Avoid making certain trips at certain times because too stressful 33) Prefer to live within walking distance of shops and transit 6) Stress Sensitivity 7) Pro-Environment 34) Willing to pay more to travel to help environment
Seven Key Transportation Factors Price Sensitivity Transit Tolerance Time Sensitivity Travel Flexibility Stress Sensitivity Social Sensitivity Pro-Environment
Top Three Factors Eight Market Segments Time Insensitive Time Sensitive Time Insensitive Time Sensitive Time Insensitive Time Sensitive Time Insensitive Time Sensitive All Travelers Price Sensitivity Price Insensitive Price Sensitive Transit Tolerance Transit Intolerant Transit Intolerant Transit Tolerant Transit Tolerant Time Sensitivity Segment 1 Segment 4 Segment 6 Segment 8 Segment 2 Segment 3 Segment 5 Segment 7
Six Santa Clara County Customer Segments LINKs & MINKs (3) Boomers & Blazers (4) Young & Restless (5,6,8) Movers & Shakers (7) Customer Type (segment number) Time Sensitivity Transit Tolerance Price Sensitivity Transit Trippers (1) Mellow Movers (2) Low Medium High
Commuters by Customer Type (2005) 600,000 500,000 Work Trip Commuters Transit Work Trip Commuters 400,000 Total Adult Population 300,000 200,000 100,000 Transit Mellow LINKs Boomers Young Movers Trippers Movers & MINKs & Blazers & Restless & Shakers
Transit Trippers High Medium Low Time Sensitivity Transit Tolerance Price Sensitivity Travel Flexibility Stress Sensitivity Social Sensitivity Pro-Enviro • High transit users • In households with no vehicles available • Lower income • Retired, unemployed or employed part-time • High school educated • Not use English as primary language They are likely to be … 9% of adults
Transit Competitive Strategy Transit Trippers Mellow Movers Young & Restless LINKs &MINKs Boomers & Blazers Movers & Shakers Transit Tolerance High Medium Low Low Medium High Time Sensitivity
Transit Competitive Factor (TCF) The next phase of the analysis combines transit planning factors with market segment research to identify areas of Santa Clara County that are amenable to transit service Transit CompetitiveFactor Transportation Land Use Factors Customer Types Trip Purposes • Trip Intensity: Origin • Customer Types • Work/School • Trip Intensity: Destination • Transit Propensity • Other • Level of Congestion • Parking Cost and Time
Transit Competitive Transit Competitive Factor - Origins 35 percent of trips go to transit competitive origins
Transit Competitive Transit Competitive Factor - Destinations 11 percent of trips go to transit competitive destinations
Application of Transit Competitive Factors • Identified transit potential by customer type (market segment), trip purpose, origins and destinations • SCVTA overhauled 90% of its countywide bus system • Focused more on market-based network (matching service with demand), rather than a coverage-based • New services focused on 15-minute or better all-day frequencies, enhanced express buses, new low-fare community bus routes