Download
1 / 39
400 likes | 655 Views
Brain tumor classification based on EEG hidden dynamics. Authors: Rosaria silipo, Gustavo Deco, Helmut Bartsch Advisor: Dr. Hsu Graduate: Yu-Wei Su. Outline . Motivation Objective Brain tumor classification and rest EEG

E N D
Brain tumor classification based on EEG hidden dynamics Authors: Rosaria silipo, Gustavo Deco, Helmut Bartsch Advisor: Dr. Hsu Graduate: Yu-Wei Su
Outline • Motivation • Objective • Brain tumor classification and rest EEG • A nonlinear characterization of the hidden dynamic of the EEG signal • A cumulant based measure of information flow • Nonlinear Markov models as an approximation of the structure of the underlying system
Outline( cont.) • A hierarchy of Markov models • The clinical application • EEG time series hidden dynamics • One- and two- dimensional analysis • Conclusion • Opinion
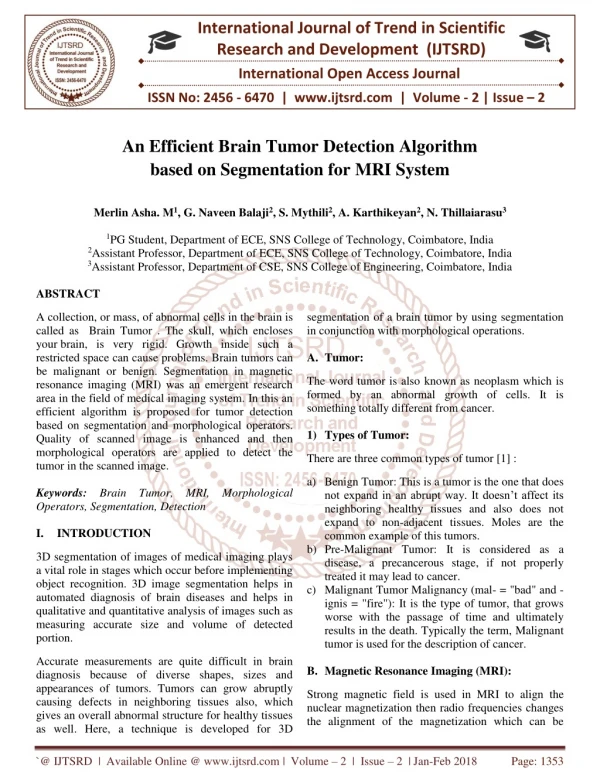
Motivation • Meningeoma or malignant glioma across EEG cannot be stated • Tumor is deeply in the brain or small with respect to the closest electrodes, no pathological change in EEG record
Objective • Analysis of hidden dynamic of the rest EEG time series , to extract more information about pathological vs. normal status of the EEG records • Nonlinear analysis can provide complex structure of the underlying system
Brain tumor classification and rest EEG • The ElectroEncephaloGraphic(EEG) signal records the background activity of the brain • The corresponding EEG time series consists of an periodic signal, call α-rthythm • When a brain tumor arises, the EEG record of the brain somehow changes
Brain tumor classification and rest EEG (cont.) • Malignant glioma and meningeoma produce similar alterations on the EEG signal • Malignant glioma consists of tumoral cells developing and expanding inside the brain • Meningeoma represents an external mass of any nature pressing against the brain from outside
A nonlinear characterization of the hidden dynamic of the EEG signal
A nonlinear characterization of the hidden dynamic of the EEG signal( cont.) • Information flow is the loss of information in the observed variables , that is the decay of the statistical dependences between the whole past system and a point r steps ahead in the future • Information flow indirectly describes the evolution of the system , that is hidden dynamic
A nonlinear characterization of the hidden dynamic of the EEG signal( cont.) • Φ, the correspondence of the information flow with the signal’s hidden dynamic, is very complicated mathematical expression • An approximate relationship statistically describes the system’s hidden dynamic with given measure of information flow
A nonlinear characterization of the hidden dynamic of the EEG signal( cont.) • Model is defined as null hypothesis and a set of surrogate data is consistently with the null hypothesis • To ascertain whether the null hypothesis is adequate to explain the hidden dynamic of the system • Information flow is calculate for both the original observed variables and the surrogate time series
A nonlinear characterization of the hidden dynamic of the EEG signal( cont.) • The null hypothesis is accepted , the model is supposed to adequately approximate the structure of the underlying system • Higher order cumulants is adopted as measure of information flow
A nonlinear characterization of the hidden dynamic of the EEG signal( cont.) • Markov models, to describe and predict the evolution of a system • Markov model is assumed as null hypothesis about nonlinear structure • A hierarchy Markovian hypotheses , starting with the Markov model with lowest order and increasing the order whenever the null hypothesis is rejected
A cumulant based measure of information flow( cont.) • The condition of statistical independence leads to
A cumulant based measure of information flow( cont.) • The statistical dependences between n1,…,nN past observations of the time series{xt}1,…,{xt}n and the point r steps ahead in time series {xt}k
A cumulant based measure of information flow( cont.) • mk(r)=0 represent a complete independence of time series k at future time t+r from the pasts of the whole system • Increasing positive values of mk(r) indicate an increasing stronger dependence
Nonlinear Markov models as an approximation of the structure of the underlying system • N-dimensional nonlinear Markov model of order{M1,…,MN} is supposed to generate time series
Nonlinear Markov models as an approximation of the structure of the underlying system( cont.) • Three two-layered feedforward NN are trained to estimate the parameters , , of the H Gaussians • To approximate the Kth conditional density of the Markov model • Three two-layer perceptrons are fed with{M1,…MN} past values of the observed time series and produce H weights, H means, H variances
Nonlinear Markov models as an approximation of the structure of the underlying system( cont.) • After NN training , Markov model can produce new sequences of data, , by MonteCarlo method new random values • New sequence form a surrogate data set, s=10
A hierarchy of Markov models • The tk(r) compares the mk(r) of the original time series K and of the ith surrogate instance of the kth time series for lookahead r • If the assumption is rejected, the order of the model is increased, {M1,…,MN}, until accepted if |tk(r)|<1.833(p-value=0.9),1<=r<=10
The clinical application • Twenty minutes of 25-channel EEG, sampled at 250 Hz
One- and two- dimensional analysis • Patient 1( no diagnosed pathology)
One- and two- dimensional analysis( cont.) • Patient 2(no diagnosed pathology)
One- and two- dimensional analysis( cont.) • Patient 3(dorsal meningeoma)
One- and two- dimensional analysis( cont.) • Patient 4 (frontal right meningeoma)
One- and two- dimensional analysis( cont.) • Patient 5 (dorsal glioma)
One- and two- dimensional analysis( cont.) • Patient 6( frontal right glioma)
Conclusion • The algorithm has a quite complicated structure • Supply different descriptions of the inter-dependence of the two brain hemispheres • Stable EEG α-rhythm means very complex structure of the underlying system • A loss of structure, when the glioma/meningeoma is located close to the thalamus region
Opinion • Increasing reading ability • Provide idea to medical research • Apply data mining to the location of the brain tumor