Download
1 / 34
340 likes | 440 Views
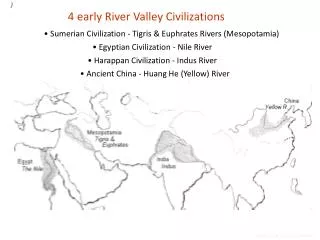
Chowan River TMDL Development Raccoon/Sappony Area 09/8/04. Impaired Waters in the Blackwater River Drainage. Raccoon Creek – Fecal Coliform Sappony Creek – Fecal Coliform Spring Branch – General Standard (Benthic). Fecal Coliform Impairments.

E N D
Chowan River TMDL Development Raccoon/Sappony Area 09/8/04
Impaired Waters in the Blackwater River Drainage • Raccoon Creek – Fecal Coliform • Sappony Creek – Fecal Coliform • Spring Branch – General Standard (Benthic)
Fecal Coliform Impairments Impaired Stream Segments in the Nottoway River watershed
Historical data analysis Source assessment Bacterial source tracking Modeling Allocation TMDL Development
Water Quality Data Analysis Location of VADEQ water quality monitoring stations used for TMDL assessment in the Nottoway River watershed
Water Quality Data Analysis Fecal Coliform Concentrations
Water Quality Data Analysis Location of BST water quality monitoring stations in the Nottoway River watershed
Water Quality Data Analysis E. coli concentrations
Water Quality Data Analysis • Statistical Analysis of Water Quality Measurements versus Precipitation to determine the relationship between rainfall and water quality • Analyzed relationships for seasonal trends • No seasonal trends found
Source Assessment • Identification of Sources • DEQ/DCR/Locality records • Ag Census • Habitat Analysis • Stakeholders, local knowledge – improve estimates • BST • Delivery Mechanisms • Direct • Land-applied • Exported Out of Watershed • Temporal Variation • Migration Patterns/Resident Populations • Import/Export of agricultural/STP waste?
Sanitary sewer Overflows - reported to DEQ Exfiltration – rate from literature Failing septic systems Rate based on age of house Straight pipes U.S. Census and VDH consultation Human
Bacterial Source Tracking Location of BST stations in the Nottoway River watershed
Modeling • Hydrologic model • Runoff model • HSPF • Water Quality model • Source Assessment Results • HSPF • Model Calibration and Validation • Based on data availability, period of interest
Modeling VADEQ Station 5ARNC003.36 and USGS Station #02045500
Modeling VADEQ Station 5ASAP013.69 and USGS Station #02045500
Modeling Source Loads • Source Characterization • Fecal production / densities / distribution • Delivery Mechanisms • Direct • Land-applied • Exported Out of Watershed • Temporal Variation
Model Load Characterization • “Direct to Stream” Loads • Point Sources: Design Flow/Fecal Discharge • Overflows: Reported overflow volume • Characterize Volume and Duration • Human: Straight pipes • “Land Applied” Loads • Wildlife, Livestock, Pets • Transported to stream during runoff producing event • Use measured waste characteristics • Compute die-off in between events • Human: Failing septic systems • Application timing
Livestock Average percentage of collected livestock waste applied throughout year
Livestock Average time dairy milking cows spend in different areas per day
Livestock Average time dry cows and replacement heifers spend in different areas per day
Livestock Average time beef cows not confined in feedlots spend in areas per day
Quantify Current Source Conditions Run model with present-day sources Develop reduction scenarios that will meet water quality standards 100% reduction in straight pipes, 25% reduction in failed septic systems 100% reduction in straight pipes, 50% reduction in livestock direct deposition Allocate loads to each source Allocation