Download
1 / 15
150 likes | 273 Views
ICES/NAFO Symposium Santander May 11 2011. Seasonal to interannual variability of temperature and salinity in the Nordic Seas: heat and freshwater budgets Katrin Latarius Detlef Quadfasel ZMAW Institut für Meereskunde Hamburg Funding: Deutsche Forschungsgemeinschaft (SFB512)

E N D
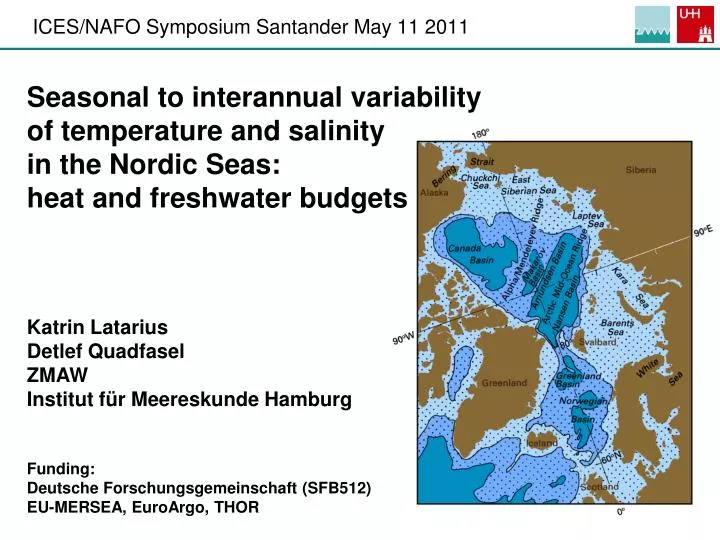
ICES/NAFO Symposium Santander May 11 2011 Seasonal to interannual variability of temperature and salinity in the Nordic Seas: heat and freshwater budgets Katrin Latarius Detlef Quadfasel ZMAW Institut für Meereskunde Hamburg Funding: Deutsche Forschungsgemeinschaft (SFB512) EU-MERSEA, EuroArgo, THOR
Background/Motivation Transformation on the way through the Arctic Mediterenean Nordic Seas: 1.5 x 10¹²m2,-50 W/m2 Nordic Seas contribute ~25% Overflow 6 Sv, 0.2°C 34.92, 28 kg/m3 + near the surface 2 Sv polar water total transformation: ∆T: 12°C ∆S: 0.37 Atlantic inflow 8 Sv, 12°C, 35.25, 26.8 kg/m3
Argo float data - circulation Quasi-Eulerian mean circulation of the Nordic Seas (1000-1500 dbar) Voet et al. ( 2010)
Argo float data - circulation Quasi-Eulerian mean circulation of the Nordic Seas (1000-1500 dbar) Voet et al. ( 2010)
Argo float data – Profiles Greenland Sea Lofoten Basin Norwegian Basin Iceland Plateau total: 3000 profiles of T, S, and σ, 0-2000m Argo-DK, Argo-Germany, Argo-Norway, MERSEA, SFB-512 2001 2005 2011
Greenland Sea Lofoten Basin Iceland Plateau Norwegian Basin 10 0 ptemp -2 Hydrography – Temperature time series
Greenland Sea Lofoten Basin Iceland Plateau Norwegian Basin 35.0 34.9 34.8 34.7 sal Hydrography – Salinity time series
Seasonal cycle of heat and freshwater fluxes, from 7 meteorological models annual mean: -53 ± 10 W/m2 22 ± 15 mm/mon The development of the heat and freshwater content in the ocean is derived from ARGO-float profile data Lateral exchange and vertical convective mixing is estimated as the residuum summer: only lateral exchange winter: lateral + vertical exchange Heat and freshwater budget Concept max. conv depth surrounding gyre Latarius & Quadfasel, 2010
22.4 ± 14.6 53.4 ± 10.2 heat (W/m2) freshwater (mm/month) Heat and freshwater budget – Greenland Sea Mean annual budgets Greenland Sea Gyre: heat is imported laterally (50-1500m) and exported to the atmosphere and in the upper 50m freshwateris imported from the atmosphere and exported laterally The surrounding of the gyre between 50 – 1500m looses heat and salt by exchange with the Greenland Sea Gyre
Heat and freshwater budget – all basins Greenland Sea winter-MLD: max. 1400m lateral exchange 50-600m: heat: + 70 W/m2 freshwater: - 35 mm/month Area: 1.0 x 10¹¹ m3 Lofoten Basin winter-MLD: max. 500m lateral exchange 50-600m: heat: + 101 W/m2 freshwater: - 18 mm/month Area: 0.9 x 10¹¹ m3 Iceland Plateau winter-MLD: max. 250m lateral exchange 50-600m: heat: + 22 W/m2 freshwater: - 8 mm/month Area: 0.4 x 10¹¹ m3 Norwegian Basin winter-MLD: max. 350m lateral exchange 50-600m: heat: + 76 W/m2 freshwater: - 31 mm/month Area: 1.7 x 10¹¹ m3
Heat and freshwater budget – all basins Contribution to the water mass transformation in direction to the overflow (50-600m) In: 12°C Out: 0°C ∆T=12°C In: 35.25 Out: 34.89 ∆S=0.37 Greenland Sea T: -0.33°C 2.6% S: -0.0084 2.3% Lofoten Basin T: -0.35°C 2.8% S: -0.0037 1% ~ 10% Iceland Plateau T: -0.04°C 0.3% S: -0.0007 0.2% Norwegian Basin T: -0.53°C 4% S: -0.0125 3.4%
Heat and freshwater budget – all basins Contribution to the water mass transformation in direction to the overflow (50-600m) In: 12°C Out: 0°C ∆T=12°C In: 35.25 Out: 34.89 ∆S=0.37 Nordic Seas: ~ 25/14% of total heat/freshwater transformation ∆T=3°C ∆S=0.05 Greenland Sea T: -0.33°C 10% S: -0.0084 17% Lofoten Basin T: -0.35°C 12% S: -0.0037 7% ~ 50% east ~ 35% west ~ 15% Iceland Plateau T: -0.04°C 1% S: -0.0007 1% Norwegian Basin T: -0.53°C 18% S: -0.0125 25%
Conclusion Greenland Sea, Norwegian Basin, Lofoten Basin (and the Iceland Plateau) of the Nordic Seas transform and redistribute the water masses at least down to 600m residence time within the basins is long winter cooling forces deep vertical mixing ~ 50% of the water mass transformation of the Nordic Seas takes please in the basins (they account for only 25% of the total area) contribution of the Nordic Seas to the total water mass transformation from Atlantic inflow to the overflow is only approx. 25% transformation in the eastern part is dominant climate induced increase of freshwater in the surface layer of the western part will at most influence 15% of the total tranformation!
Dataset Dataprocessing: Receiving data from Argos, converting from hex to decimal and real-time quality check at Coriolis Data Centre (within 1 day after profile is measured) Quality check by eye Delayed mode quality control for S at ARGO standard: Objective mapping procedure to compare with recent and historical CTD data (Böhme, Send, 2005), correction if difference is larger than 0.01 psu.(every ½ to 1 year) Using only profiles within f/h contour of GS gyre Computing monthly mean values of all floats in the gyre Deleting extreme values 2 from 8 floats have been corrected because of distinct offset/trend in S Reduction from 915 to 546 profiles