Download
1 / 27
280 likes | 535 Views
Marketing Milk. Processing Dairy Products Unit 1. Introduction. Dairy farmers produce milk to sell it for a profit Management helps reduce costs of production Management decisions are influenced by Price, supply and demand trends for milk and dairy products Markets available for milk

E N D
Marketing Milk Processing Dairy Products Unit 1
Introduction • Dairy farmers produce milk to sell it for a profit • Management helps reduce costs of production • Management decisions are influenced by • Price, supply and demand trends for milk and dairy products • Markets available for milk • Pricing structure and regulation of milk marketing
Price of Milk • Long term trends • See fig. 46-1, 46-2, 46-3 p. 834-35 Modern Livestock and Poultry Production • Seasonal Variation • Amount of milk produces varies month to month • Variation is less now than it used to be • National average production is highest in May and lowest in November • Fluid milk consumption is lowest in June • WHY?? • Price also varies • Lowest in May, June • Highest in Oct, Nov, Dec
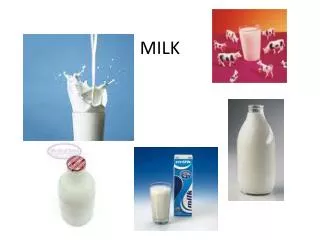
Products Made from Milk • Four major uses • Fluid, cheese, butter, frozen • Use about 96% of the milk processed in the US
Fluid Milk • Whole, low-fat, skim milks, coffee cream, whipping cream, half and half, sour cream • Make up about 36% of the milk produced in the US that is used for fluid milk products
Cheese • 30% of milk produced • 67% of the cheese made is American-type, mainly cheddar and Colby • Italian type cheese makes up 25% • Swiss cheese makes up about 6% • Other cheese types make up the rest
Butter • About 20% of milk produced • Only uses the SNF parts of the milk, the rest is used to produce non-fat dry milk and condensed skim milk • More butter and nonfat dry milk products are produced when milk production is highest—surplus milk is used to make these products
Frozen Dairy Products • 10% • Ice cream, ice milk, sherbet are the major products produced
Other • Evaporated and condensed milk and buttermilk, dry buttermilk, dry whole milk, dry skim milk, dry cream, dry whey, lactose, yogurt • Use about 4% of the milk produced
Trends in the Consumption of Dairy Products • Fig. 46-4 • Continued research and development of old and new dairy products • Projections of demand for dairy products show an expected increase in the use of fluid low-fat milk, fresh cream, cheese, ice cream and butter • WHY??? • Demand is affected by population, price, purchasing power of consumers, promotion
Advertising Dairy Products • Prior to 1983 • Generic and off-brand product promotion was funded by voluntary contributions from producers through local and state organizations • 1983 • Congress establishes a mechanism for a dairy check-off program with the passage of the Dairy and Tobacco Adjustment Act of 1983 • This established the National Dairy Promotion and Research Board • They are in charge of developing and administering promotion, research and nutrition programs for the dairy industry
Advertising Dairy Products • Dairy farmers approved the continuation of the Dairy Check Off Program in 1993 • 1995-Dairy Management Inc (DMI) was organized to coordinate local and national dairy promotion programs • Established the US Dairy Export Council to help promote and market US Dairy Products in international markets
Check-Off Money • Promotion of fluid milk and cheese receives highest priority • Estimated that 200 billion more pounds of milk has been sold than was projected by USDA since check-off began in 1984
Markets for Milk • More than $21 billion worth of milk is produced each year on dairy farms in the US • 86% of this is sold through farmer milk marketing co-ops • Rest is sold to private firms, used on the farm, sold directly to consumers • Looking to the future…. • Dairy co-ops are expected to decline • However co-ops will become larger and provide more services
Services Provides by Farmer Cooperatives • Provide more services • Major services • Checking weights and tests • Guaranteeing daily markets for milk • Providing marketing and outlook information • Providing field services such as assisting with production problems • Collecting and insuring payment from buyers • Assisting with inspection problems • Providing insurance programs • Negotiating hauling rates • Selling milking supplies and equipment
Market Wide Services Provided by Cooperatives • Maintaining quality control and related lab services • Direct farm-to-market movement of milk • Handling milk in excess of Class I use • Participating in federal order hearings • Paying milk haulers • Negotiating Class I prices and service charges • Maintain a full supply of milk • Balancing milk supplies among processors to reduce reserve requirements • Making out-of-market raw milk sales
Hauling Milk To Market • Most is hauled fro the farm to the plant by bulk trucks • Milk is being hauled farther • Due to: fewer dairy farms, larger herds, fewer dairy plants • Costs • Increased due to increase in fuel and labor costs, larger bulk trucks
Milk Grades • 1924- US Public Health Service developed Standards Milk Ordinance • These were to help states and local governments prevent diseases that spread through milk • Adoption is voluntary but widely used as the model for regulating the production and processing of Grade A fluid milk • Ordinance has been revised and is now called Grade “A” Pasteurized Milk Ordinance • This is recognized by public health agencies and the milk industry as the national standard for milk sanitation
Ordinance Standards • Cleanliness of facilities • Temperature for storing milk • Bacterial count • Somatic cell count • Chemical residues • Other factors relating to the production and processing of milk for human consumption
Grade “A” Raw Milk • Must be cooled to 45 degrees F or less within 2 hours of milking • Blend temperature after the first and subsequent milking cannot exceed 50 degrees F • Each farmers milk cannot exceed 100,000 bacterial count per milliliter before it is mixed with other producers • Bacteria count from several producers cannot exceed 300,000 bacterial count/ mL before it is pasteurized • Each producers milk cannot exceed 750,000 somatic cells per milliliter • Can be no detectable antibiotics • Inspections on the farm are made regularly and the permit to sell Grade A milk can be suspended if violations are found and not corrected.
Grade B Milk • Produced under standards that allow it to be used for manufacturing of dairy products but not for fluid milk • Standards are not as strict as for Grade A milk • Complete standards may be found at www.ams.usda.gov/dairy/index.htm • Grade B standards address the same things as Grade A standards
Federal Milk Marketing Order Program • Read p. 840-842 in Modern Livestock and Poultry Production Text
Dairy Imports and Exports • Relatively low for a number of years • Imports • Generally less than 2% of total production • Dried milk, butter, several types of cheese are protected by import quotas • Exports • Below 1% of total production • Limited due to higher US prices
Price of milk rose from 1967-1998 Prices and production vary seasonally with the highest production and lowest prices in May and June 96% of the milk processed in the US is used for fluid milk, cheese, butter or frozen dairy products Per capita consumption of cheese, dry whole milk and non-fat dry milk has increased in recent years Demand for other dairy products had decreased 86% of the milk produced in the US is marketed through Co-ops Co-ops provide many services to the producers as well as the market Milks is hauled to market in bulk trucks and the cost of hauling as increased in recent years Milk is divided into classes for pricing, Class I is the highest priced Federal milk marketing orders are established in many areas, and the minimum prices for Grade A milk are set there Actual price paid is often higher than the one set by the order Dairy imports and exports have been at a low level for many years. Summary
Assignment • Complete discussion question #’s • 3, 5, 7, 12, 13, 15 p. 843-844 • Complete Review Questions p. 844