Data Pre-processing
310 likes | 452 Views
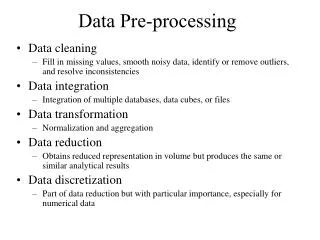
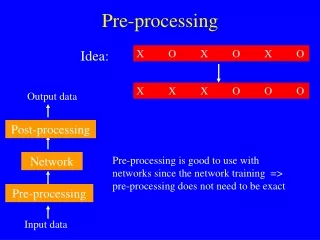
Data pre-processing involves a series of actions to enhance data quality for analysis by addressing issues like incomplete data, outliers, and inconsistencies. Various methods such as data cleaning, integration, transformation, and reduction are used to prepare data for effective analysis. Missing value handling in data cleaning presents challenges and methods like prediction-based filling or mean substitution are commonly employed. Noise removal techniques like binning and combining human and computer power help in smoothing out data. Data integration merges multiple sources, while data transformation optimizes data formats for mining algorithms. Resolving redundancy and conflicts in integrated data is crucial. Data transformation methods like aggregation, generalization, and normalization are applied for improved data mining outcomes.

Data Pre-processing
E N D
Presentation Transcript
Lecture 3 GoncaGulser Data Pre-processing
What is it? Ideas???? Definition: Series of actions to improve the quality of data for making it ready to any kind of analysis
Possible Problems... • Identifying INCOMPLETE data • Missing attribute • Lack of Attribute Values • Contain only aggregate data • Eliminate NOISE • Errors • Outliers (should we always get rid of them? Any special case?) • Identify INCONSISTANCY • A value can be code differently across whole DB • Too DISPERSE to analyse • Too many attributes for any algorithm.
Forms of Data Pre-process • Data Cleaning • Data Integration • Data Transformation • Data Reduction
Data Cleaning • Missing Value Handling • Smooth out Noise • Correct inconsistencies
Missing Value Handling (Data Cleaning) Any ideas???
Missing Value Handling (Data Cleaning) • Methods from 3 to 6 are biased. - The generated values might not be correct so it increase the algorithm's error rate • 6th method is the most popular one because it uses more past data to predict the current situation... You must be sure that your past data is reliable... • Ignore Tuple • not very effective especially if the tuple contains several missing. • It is poor when the percentage of missing values per attribute varies considerably • Fill the missing Manually • Time consuming especially in huge datasets • Use global constant to fill in the missing • Replace with “unknown” or “missing” • Not useful because may lead Data mining tool to produce interesting results for them • Use attribute mean/mode/median to fill the missing value • What about categorical data? • Why is mean dangerous? • Skewed data • Use the attribute mean for all sample belonging to the same class • Categorize the attributes & Use mean of each category to fill the missing • Use the most probable value to fill in the missing value • Regression/inference-based tools/ decision tree
Smooth out Noise(Data Cleaning) What is Noise? - Random error or variance in the measured data Methods 1) Binning • Sort the data • Divide into equal chunks (bins) • Get the mean of each bin and replace|| Smoothing with boundaries Sorted data for price= 4,8,15,21,21,24,25,28,34 Partition into Bins: Bin1: 4,8,15 Bin2: 21,21,24 Bin3: 25,28,34 Smoothing By means Bin1: 9,9,9 Bin2: 22,22,22 Bin3: 29,29,29 Smoothing By boundaries Bin1: 4,5,15 Bin2: 21,21,24 Bin3: 25,25,34
Smooth out Noise(Data Cleaning) cont... 2) Combined Human and Computer Power By any given algorithm let computer produce an outlier or noise list called “surprise” Then go over the list and remove the irrelevant data by hand... It is easier and time saving than go through all data set 3) Regression Linear MultiLinear Logarithmic 4) Other methods Data reduction involving discretization (divide data into sub-categories like low\medium\high) such as decision tree reduce the data step by step Concept Hierarchies- a form of discretization also used for noise
Forms of Data Pre-process • Data Cleaning • Data Integration • Data Transformation • Data Reduction
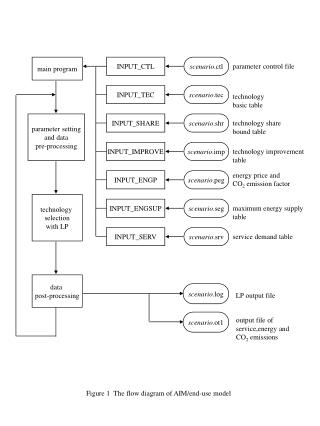
Data Integration and Transformation • What is it? INTEGRATION: Merge Data from multiple data sources TRANSFORMATION: Transform data into an appropriate format for any given data mining algorithm.
Data Integration • Schema Integration Meta Data can solve the problem... ex: Cut_id and cust_number are same thing • Redundancy • An attribute is redundant if it can be derived from any given attribute in the database ex: annual revenue • Can be detected by correlation analysis • Remove one of the duplicate attributes • Detection and Resolution of Data Conflicts Because of different metrics and different perceptions on data, multiple sources have same data in totally different formats and logic. Examples: • A unit may be hold in European metric system (kg) in one data source and in British metric system (pounds) in another data source • A price of a room may be in different currencies and also may contain different attributes (such as Hilton's room price may include breakfast but Sheraton’s may not) • If result > 0, then A and B are positively correlated • If result < 0, then A and B are negatively correlated • If result = 0, then A and B are not correlated
Data Transformation • Transform or consolidate data into appropriate forms for Data Mining • Methods • Smoothing – Get rid of noise • Aggregation – Summary or aggregation operation. To use data to calculate new measure. (calculated measure in OLAP cubes) e.x. Using daily sales to calculate quarterly or annual sales. • Generalization – Transform into higher level concept e.x. Concept hierarchies or divide age into young\medium\old • Normalization – fall the data into specific range usually -1 to 1 • Useful for classification and clustering algorithms. • The classification algorithms like neural networks, needs data into the range between -1 to 1 • Distance based clustering algorithms like k-means does not require data into range. However, we usually need to normalize values in order not give over emphasize on naturally higher value attributes. e.x. If we put age and salary as attribute we need to normalize both in order to get rid of the effects of higher values of salary.
Data Transformation cont... Normalization Algorithms • Min-Max normalization – performs linear transformation on the original data e.x Suppose that the min and max values for the attribute income are $12,000 and $98,000 we would like to map the income to the range 0.0, 1.0. By min-max normalization a value of $73,600 for income is transformed to (73,600-12,000)/(98,000-12,000)= 0.716
Data Transformation cont... • Z-score normalization – the values of an attribute is normalized based on mean and the standard deviation of the attribute. e.x Suppose that the mean and the standard deviation of income are $54.000 and $16,000 respectively. With z-score normalization, a value for $73,600 is transformed to (73,600-54,000)/16,000 = 1.225
Data Transformation cont... • Normalization by decimal scaling – normalizes by moving the decimal points moved depends on the maximum absolute value of the attribute Vnormalize= where, j is the smallest integer that max(vnormalize)=1 e.x. Suppose that the value range for A is -986 – 917. The maximum absolute value for A is 986. To normalize based on decimal scaling we need to divide each value by 1000 (j=3) so that -986 normalizes to -0.986
Data Transformation cont... • Attribute Construction (feature construction) – new attributes are constructed and added from the given set of attributes to help the mining process e.x adding attribute area to data set by using height and width
Forms of Data Pre-process • Data Cleaning • Data Integration • Data Transformation • Data Reduction
Data Reduction • Make the amount of data smaller • Be Careful!!!! • Reduced dataset should represent the original data set • Results of reduces dataset should be reflect the original sets data • Reduction should ease and fasten the data mining process • Data Reduction Strategies • Data Cube Aggregation – aggregation should be applied to construct data cubes • Dimension Reduction – irrelevant, weakly relevant or redundant attributes or dimensions may be detected and removed • Data Compression – encoding mechanisms are used to reduce the data set size • Numerosity Reduction – data is replaced or estimated by using a smaller data representation • Discretization and concept hierarchy generation – data values for attributes are replaced by ranges or higher conceptual levels. No Reduction Golden Rule – Reduction Time > Saved Time
Data ReductionData Cube Aggregation • Climbing up the upper level of concept hierarchy... OLAP facility to summarize data
Data Reduction Dimension Reduction • Reduce the irrelevant or redundant attributes • Select the attribute subsets – attribute subset selection: find the minimum subset of attributes to perform data mining action by not effecting the reliability and robustness. • AWARE!!! All methods can only find local optimum... we just hope the local one is also global optimum METHODS: • Stepwise Forward Selection – start with empty set. Add one by one attributes. Stop if no more information gained ... • Stepwise Backward Selection – start with full set of attribute. Eliminate one by one until information gain changed significantly • Combination of Forward and Backward Selection – in each step algorithm selects the best attribute and eliminates the worst attribute • Decision Tree Induction – When constructing a tree, algorithm starts with the best attribute and get the second best and so on... Algorithm stops when there is not any significant information gain.
Data ReductionData Compression • Data encoding and transformations are applied to obtain a reduced or compressed representation of the original data. • If the original data can be reconstructed from the compressed version, the technique is called “lossless” • If only the approximation is gained after reconstructing, the technique is called “lossy” • Two main techniques • Wavelet Transformation • Principal Component Analysis (PCA) METHODS: • Principal Component Analysis – It searches the c (components) in the k-dimensional orthogonal vectors that can be best represent the data where c<=k • PCA can also be used as dimension reduction also • I t can not eliminate the attributes to form new attribute set. PCA construct totally new attributes (components) that can explain the min %70 of all attributes.
Data ReductionNumerosity Reduction • Gathering a smaller representation of original data. A way of getting samples from original data. • AWARE!!! not to loose essence of data... Best representative should be chosen. • Techniques • Regression & Log linear model – they can handle skewed data. They both are sensitive to high dimensions (We will deal with them in clustering in detail) • Histograms: Use binning to approximate data distributions and are a popular form of data reduction. A histogram for an attribute A partition the data distribution of A into disjoint subsets or buckets The buckets are displayed on horizontal axis, while the height (area) of a bucket typically reflects the average frequency of the values represented by the bucket.
Data Reduction NumerosityReduction- Histograms • How are the buckets determined and the attribute values partitioned? • Partition Rules: Equiwidth – the width of the bucket range is uniform. Equidepth – the buckets are created so that, roughly, the frequency of each bucket is constant (each bucket contains the sane number of contiguous data samples) V-optimal – Histogram with the least variance Histogram variance is a weighted some of the original values that each bucket represents, where bucket weight is equal to the number of values in the bucket. (if data is one dimensional, V-optimal is K-means) MaxDiff – The difference between each pair of adjacent values. A bucket boundary is established between each pair for pairs having the K-1 largest difference, where K is specified by user
Data Reduction NumerosityReduction- Histograms • Properties of Histograms • Highly effective at approximating both sparse and dense data • Effective at approximating skewed and uniform data • Histograms can be multidimensional • Multidimensional histograms can capture dependencies between attributes • Multidimensional histograms are good at handling data sets that have up to 5 dimensions. • They also are good to store outliers as well.
Data Reduction Numerosity Reduction cont... Other than histograms also the following used for numerosity reduction • Clustering • Sampling • Simple Random Sampling • Simple Random Sampling with replacement • Cluster Sample • Stratified Sample
Data Reduction Discretization and Concept Hierarchy Generation • Reduce the number of values for a given continues attribute by dividing the range of the attribute into intervals. • Discretization and concept hierarchy generation for Numeric Data • Binning • Histogram Analysis • Cluster Analysis • Entropy-Based Discretization – An info based measure called “entropy” can be used to recursively partition the values of numeric attribute A, resulting in a hierarchical discretization (we come back at decision trees) • Segmentation by natural partitioning – user defined partitioning
Data Reduction Discretization and Concept Hierarchy Generation • Reduce the number of values for a given continues attribute by dividing the range of the attribute into intervals. • Discretization and concept hierarchy generation for Numeric Data • Binning • Histogram Analysis • Cluster Analysis • Entropy-Based Discretization – An info based measure called “entropy” can be used to recursively partition the values of numeric attribute A, resulting in a hierarchical discretization (we come back at decision trees) • Segmentation by natural partitioning – user defined partitioning • For categorical data • Basically user defined concept hierarchies and discretization • e.x. Geographical location, job category, colours and etc
Data Reduction Discretization and Concept Hierarchy Generation cont... • For categorical data • Basically user defined concept hierarchies and discretization • e.x. Geographical location, job category, colours and etc
Thank You !!! Q&A