Download
1 / 38
380 likes | 497 Views
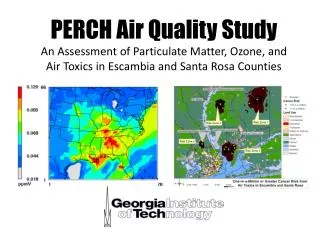
Three-State Air Quality Study (3SAQS) Three-State Data Warehouse (3SDW). 3SAQS Pilot Project Modeling Overview University of North Carolina (UNC-IE) ENVIRON International Corporation (ENVIRON ) October 10, 2014. Summary. 3SAQS Pilot Project Timeline and Deliverables

E N D
Three-State Air Quality Study (3SAQS)Three-State Data Warehouse (3SDW) 3SAQS Pilot Project Modeling Overview University of North Carolina (UNC-IE) ENVIRON International Corporation (ENVIRON) October 10, 2014
Summary • 3SAQS Pilot Project Timeline and Deliverables • Emissions Inventory Improvements • Key Collaborations and Interactions • Modeling Highlights • WRF Meteorology • SMOKE Emissions • CAMx Air Quality • Oil and Gas Inventories • Monitoring Network Analysis • 3SDW Support and Tool Development • Status and Next Steps
3SAQS Pilot Project Timeline JAN 2013 EI Improvement Meetings With CO, UT, WY AUG 2012 CAMx 2008a SEP 2014 SMOKE 2011a FEB 2014 3SAQS Monitoring Network Report OCT 2012 Pilot Project Start NOV 2014-APR 2015 CAMx 2011 Sensitivities FEB-MAY 2012 2008 EI Modeling JUL 2014 Final 2008 Emissions 2014 2012 2013 AUG 2014 CAMx 2008b, WRF 2011, 2011 Oil & Gas EI, 2011a Emissions OCT 2013 WRF 2011 Sensitivities NOV-DEC 2012 CO, UT, WY 2008 EI Analysis and Evaluation JUN 2012 Emissions VOC Reactivity Analysis MAR-JUN 2014 2011 EI Modeling OCT 2014 CAMx 2011a MPE
3SAQS Pilot Project Major Deliverables • Emissions • 2011 O&G inventory • Data updates for 3-state sources • 2008, 2011, 2020 inventories • Fusion of NEI and 3-state inventories • Monitoring Network Assessment • Modeling Platforms • Modeling input/output data, software, and scripts • 2008 version A and B • SMOKE and CAMx • Base and Future Year (2020) • 2011 version A • WRF, SMOKE, and CAMx • Base and Future Year (2020)
3SAQS Pilot Project Major Deliverables • Modeling Sensitivities • Boundary conditions • US background air quality • Ammonia emissions • Oil and gas emissions • Winter ozone • Key Analysis Products • Inventory comparisons • VOC reactivity analysis • Model performance evaluations • CAMx 2008 • WRF 2011 • CAMx 2011 • Methane inventory analysis
Key Findings: Meteorology • Completed 2011 WRF modeling and evaluation • 2008 and 2011 WRF performance acceptable and comparable • WRF configuration based on systematic configuration testing • Episodic performance issues, particularly for winter inversions Observed May 2011 Total Precip (in.) WRF May 2011 Total Precip (in.)
Key Findings: Emissions • New 2011 O&G EI • 2008 > 2011 > 2020 • Trends vary by state/sector/pollutant • General decrease in emissions through time • Exception is VOC from O&G sources
Key Findings: Emissions • Collaboration with CO, UT, WY state DAQs to obtain data, review emissions, and get feedback on protocols/evaluations • Updates to key sectors/pollutants • Agricultural NH3 – point CAFO locations used to improve the spatial allocation of livestock emissions • On-road mobile – link-based VMT from CO used to improve spatial allocation of on-road mobile sources in CO • Review of 3SAQS updates to temporal and chemical speciation profiles for nonroad and nonpoint sources
Key Findings: Emissions • 2020 – 2011 Emissions • Mostly decreases for all sectors/pollutants/states except O&G VOC/TOG • Plots show differences by state (CO, UT, WY)
Key Findings: Emissions • Methane • 3SAQS one of the first U.S. regional CTM studies to look at active methane emissions • Tracer for important regional emissions sectors (O&G and ag) • O&G is the largest source in the current inventory • Missing significant agricultural sources: enteric fermentation and livestock waste
Key Findings: Emissions Emissions Reactivity RTOG = TOG * Profile Total MIR RTOG/TOG = Relative emission reactivity
Key Findings: Emissions • Emissions Reactivity • Reactivity-based analysis of inventories focuses on sources with greatest ozone formation potential • Different sources are dominant using reactivity weighting vs. mass-based analysis • Reactivity analysis is dependent on validity of inventory and chemical speciation
Key Findings: Air Quality 2008 Annual 4th Highest Daily Max 8-hour Average O3 65 ppb 70 ppb 75 ppb Orange is the cutoff for different O3 standards
Key Findings: Air Quality 2020 Annual 4th Highest Daily Max 8-hour Average O3 65 ppb 70 ppb 75 ppb Orange is the cutoff for different O3 standards
Key Findings: Air Quality 2020 - 2008 • 4th highest MDA8 O3 decreases up to 25 ppb • Widespread decreases of 1-3 ppb for most of the 3-state region • 1-3 ppb increases in O&G development areas
Key Findings: Air Quality 2020 - 2008 • 4th highest MDA8 O3 decreases up to 25 ppb • Widespread decreases of 1-3 ppb for most of the 3-state region • 1-3 ppb increases in O&G development areas
Key Findings: Air Quality 2008 Annual 4th Highest Daily Max 8-hour Average O3 65 ppb 70 ppb 75 ppb Orange is the cutoff for different O3 standards
Key Findings: Air Quality 2011 Annual 4th Highest Daily Max 8-hour Average O3 65 ppb 70 ppb 75 ppb Orange is the cutoff for different O3 standards
Key Findings: Air Quality Annual Average PM2.5 2008 2020 (2008-based) 2011 Orange is the cutoff for 12 ug/m3
2011 base year inventories developed for all major basins in the 3 states Uinta (UT) Piceance (CO) D-J (CO) All Wyoming Basins (WY) Raton Basin (CO/NM) Paradox Basin (UT) South San Juan Basin (NM) 2020 projections developed for all basins 2011/2020 emissions processed through SMOKE and model-ready Oil and Gas Emissions Development Activities
2011 base year inventories provide updated county-level and by-source category NOx and VOC emissions Developed by projecting older inventories forward to 2011 considering changes in production and activity, as well as regulatory effects on emission sources Further projections conducted out to 2020 using historic development trends and forecasts, regulatory effects on inventories Emissions processed and gridded using SMOKE including industry-specific speciation profiles and detailed spatial allocation of wells and production Oil and Gas Emissions Development Activities
Forecasting Activity to 2020 2020 gas production forecast in the Uinta Basin
Example Controls Analysis Federal regulatory controls in the Piceance Basin in 2020
Oil and Gas Inventory Results for 2011/2020 * Permitted emissions only
Example Emissions by Source Category 2011 NOx emissions by source category in the D-J Basin
Example Emissions by Source Category 2011 VOC emissions by source category in the D-J Basin
Example Emissions by County 2011 NOx emissions by county in the Uinta Basin
Example Processed and Gridded O&G Emissions June 2011 gridded oil and gas emissions in 4-km modeling domain
Ongoing work Data mining of US EPA Tribal Minor New Source Review (MNSR) data on tribal land to improve emissions sources Guidance document on incorporation of 3SAQS regional emissions into project analyses Potential future work Improved projection methodologies for midstream and other permitted sources or sources provided by state agencies Additional survey efforts to update key source category data in key basins Ongoing Oil and Gas Tasks and Next Steps
Monitoring Network Assessment RecommendationsOperations Through 2017 • Assessment of ozone monitoring data, meteorology, and unmonitored areas, as well as expected changes in emissions indicate that the existing 3SAQS cooperator group-funded site locations/areas should continue operating through 2017. • Recommending slight changes to some existing site locations, as well as adding new sites. • There are two sets of recommendations, for calendar 2014 and for 2015 to 2017. • Assessment was reviewed and approved by the Steering Committee in May 2014. • Final assessment materials available on the 3-State Data Warehouse website (http://views.cira.colostate.edu/documents/Projects/TSDW/Projects/MonitoringNetworkAssessment/)
Prototype Web-Based Source Apportionment Visualization Tool • Develop on-line tool for the 3SDW that can visualize ozone and PM source apportionment modeling results • Use WestJumpAQMS state-specific and source category-specific ozone source apportionment results to test the tool • Daily maximum 8-hour ozone for Geographic (state-specific) and Source Category SA runs • In 3SAQS will expand from 10 highest ozone days to all days and monitors in domain
SrcApp Visualization Selection • Currently two options
Select Rocky Flats North, CO on July 9, 2008 Geographic Source Category
Web-Based SA Visualization Tool • Refine prototype SA visualization tool • Populate with 3SAQS CAMx and CMAQ SA runs when available • Daily maximum 8-hour ozone and 24-hour PM2.5 concentrations at all monitors in domain • Annual deposition and daily visibility impairment at IMPROVE monitors • Implement on 3SDW
Status and Next Steps • Pilot study modeling work status • Plans for October 2014 – April 2015 • 2011 CMAQ modeling • 2011 AQ sensitivity modeling • Boundary Conditions • Background Air Quality • Oil & Gas • Winter Ozone • Ammonia • Vertical Transport • MOVES2014 • Reference 9/30 presentation
2011 US Background Air Quality • July 2011 US Background