Download
1 / 52
530 likes | 547 Views
Predicted climate change and its impact on agriculture in Malaysia. MALAYSIA’S CLIMATE. Malaysia has a tropical climate: hot and humid General characteristics uniform air temperature high humidity high and heavy rainfall low wind speed cloudy rarely clear skies even during drought periods.

E N D
Predicted climate change and its impact on agriculture in Malaysia
MALAYSIA’S CLIMATE • Malaysia has a tropical climate: hot and humid • General characteristics • uniform air temperature • high humidity • high and heavy rainfall • low wind speed • cloudy • rarely clear skies even during drought periods
INCREASING CLIMATE VARIABILITY AND CHANGE: Reducing the Vulnerability of Agriculture and Forestry; Edited by James Salinger, M.V.K. Sivakumar, and Raymond P. Motha; Springer, Netherlands, 2005
Köppen Climate Classification System • 5 climate regions • A - Tropical Moist Climates: all months have average temperatures above 18° Celsius • B - Dry Climates: with deficient precipitation during most of the year • C - Moist Mid-latitude Climates with Mild Winters • D - Moist Mid-Latitude Climates with Cold Winters • E - Polar Climates: with extremely cold winters and summers
Mean annual cloud cover (1983-2008) International Satellite Cloud Climatology Project (ISCCP) http://isccp.giss.nasa.gov Rossow, W.B., and Schiffer, R.A., 1999: Advances in Understanding Clouds from ISCCP. Bull. Amer. Meteor. Soc., 80, 2261-2288.
Mean for whole Earth = 240 Wm-2 per day http://www.scilogs.eu/en/blog/spacetimedreamer/2009-06-15/the-sunniest-and-darkest-places-on-earth
Monthly relative humidty (RH) • mean monthly 70 to 90% • difference between mean monthly min. and max. RH about 3-15% • usually min. RH in Jan-Feb • except east coast Kelatan and Terengganu, min RH during March • usually max. RH in Nov • in Peninsular, average 84% in Feb. and 88% in Nov. • but Northwest states in Peninsular: 72% in Feb. and 87% in Nov
Daily RH • Northwest states also has the highest diurnal variation in RH • in dry months, min daily RH can be 42% • in wet months min daily RH can be as high as 70% • max daily RH does not vary much from place to place • never below 94% RH
Annual air temperature • Being near the equator, Malaysia has a uniform temperature throughout the year • annual variation less than 2 C except for the east coast areas in Peninsular Malaysia which are affected by cold winds from Siberia during the northeast monsoon (< 3 C variation) • Daily air temperature • typically varies between 20-30 C • 5-10 C variation in coastal areas • 8-12 C variation in inland areas • very rarely above 38 C
Monthly air temperature • Apr-May have the highest monthly air temperature • Dec-Jan the lowest air temperature
Wind has four seasons: southwest monsoon, northeast monsoon, and two other shorter intermonsoon seasons • southwest monsoon • May/June to Sept. • < 15 knots (note 1 knot = 0.5 m s-1) • northeast monsoon • Nov to March • 10-20 knots • may reach 30 knots in east coast areas in Peninsular Malaysia • cold winds from Siberia • Apr-Nov, typhoon in neighbouring countries, may bring strong winds to Sabah and Sarawak (>20 knots)
Rainfall • 2500 mm mean annual rainfall (note: 1 mm = 1 L or 1 kg of water in 1 m2) • affected by wind flow (monsoons) and topographic features • Seasonal rainfall in Peninsular Malaysia • A) East coast • Nov-Jan: wettest & June-July: driest • B) Southwest areas • Oct-Nov: wettest & Feb: driest • C) The rest • 2 periods of maximum (Oct-Nov and Apr-May) and 2 periods of minimum (Jan-Feb and Jun-July) rainfall
Seasonal rainfall in Sabah and Sarawak • A) Coastal Sarawak and northeast Sabah • Jan: wettest • June/July is the driest in Sarawak but April in Sabah • Dec-Mar is the main source of rain for west Sarawak • B) Inland Sarawak • evenly distributed rain, slightly lower in Jun-Aug. • hill slopes in inland Sarawak has the highest rainfall in Malaysia (e.g., Long Akah has >5000 mm annual rain)
C) Northwest coast Sabah • 2 periods of maximum (Oct and June) and 2 periods of minimum (Feb and Aug) rainfall • D) Central Sabah • hilly and sheltered areas • low rainfall and evenly distributed with less distinct 2 periods of maximum (May and Oct) and 2 periods of minimum (Feb and Aug) rainfall • E) Southern Sabah • evenly distributed rain • amount of rain received is like Central Sabah, but Feb-Apr is slightly drier than the rest of the year
Sunshine and solar radiation • average 6 hours of sunshine (>120 W m-2) per day • Alor Setar and Kota Bharu • avg. 7 hours per day • but 8.7 hours per day in Jan • Kuching • avg. 5 hours per day • but 3.7 hours per day in Jan
Evaporation (ET) • indicates amount of water loss by evaporation into the atmosphere • affected by cloudiness and air temperature, also by RH and wind speed • more clouds and high RH, less ET • high temperature and high wind speed, more ET • lowland areas: 4 - 5 mm per day • highland areas: 2.5 mm per day
Trends in climate change in Malaysia • Temperature records in Malaysia in the last 50 years have shown warming trends • But insufficient data to determine whether the frequency of extreme events (e.g., drought, storms and floods) has indeed increased Balanced scorecard for natural disaster management projects; Tun Lin Moe, Fritz Gehbauer and Stefan Senitz; Disaster Prevention and Management; Vol. 16 No. 5, 2007; 785-806
Landslide A total of 19 natural disasters in Malaysia (1968-2004) About one natural disaster every 2 years Disaster types in Malaysia: an overview; Ibrahim Mohamed Shaluf, Fakhru'l-Razi Ahmadun; Disaster Prevention and Management Volume: 15 Issue: 2, 2006, 286-298
Linear Regression Line Mean increase per decade = +0.18 C INCREASING CLIMATE VARIABILITY AND CHANGE: Reducing the Vulnerability of Agriculture and Forestry; Edited by James Salinger, M.V.K. Sivakumar, and Raymond P. Motha; Springer, Netherlands, 2005
INCREASING CLIMATE VARIABILITY AND CHANGE: Reducing the Vulnerability of Agriculture and Forestry; Edited by James Salinger, M.V.K. Sivakumar, and Raymond P. Motha; Springer, Netherlands, 2005
Climate Change Scenarios for Malaysia 2001-2099. Scientific Report; Malaysian Meteorological Dept. (2009)
Climate Change Scenarios for Malaysia 2001-2099. Scientific Report; Malaysian Meteorological Dept. (2009)
* IPCC WG1 4TH ASESSMENT REPORT (AR4), 2007 ** STUDY ON IMPACT OF CLIMATE CHANGE ON HYDROLOGIC REGIME AND WATER RESOURCES OF PENISULAR MALAYSIA, NAHRIM, 2006 NAHRIM (National Hydraulic Research Institute of Malaysia)
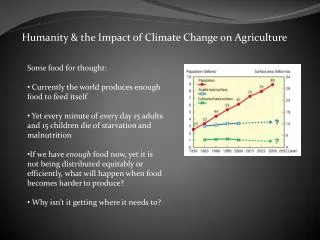
Generally, crop yields in Malaysia would increase in • higher CO2 concentrations, lower air temperatures, higher wind speeds, lower humidity • more sunshine hours (or less clouds) • greater solar radiation, greater energy for photosynthesis • lower air pollutants • more rainfall • in normally dry areas, but may increase pests and diseases incidences • or less rainfall • in normally wet areas • But these above factors interact with each other to affect yields • so what is the net effect of climate change on yields?
Effect of climate change on rubber Yield in ton/ha/yr INCREASING CLIMATE VARIABILITY AND CHANGE: Reducing the Vulnerability of Agriculture and Forestry; Edited by James Salinger, M.V.K. Sivakumar, and Raymond P. Motha; Springer, Netherlands, 2005
Rubber flourishes in a tropical climate • with a high mean daily air temperature of 25-28 C • high rainfall exceeding 2000 mm per year • even distribution of rainfall with no dry seasons exceeding one month • at least 2100 h of sunshine per year • 5.75 h per day
If the mean daily air temperature increases by 4.5 C above the mean annual temperature, more dry months and hence more moisture stress can occur • A crop decrease of 3–15% due to drought conditions is projected if mean annual temperature increases to 31 C • The degree of yield decrease will be dependent on clonal susceptibility, as well as the length and severity of the drought • Some states may experience a reduction in production. • It is projected that 273,000 ha of land, or 15% of current rubber land, may be affected
If rainfall increases, loss of tapping days and crop washout occur • Yield losses can range from 13 to 30% • If sea level rises by 1 m, low-lying areas may be flooded and rubber cultivation would not be possible in these areas
Effect of climate change on oil palm Yield in ton/ha/yr INCREASING CLIMATE VARIABILITY AND CHANGE: Reducing the Vulnerability of Agriculture and Forestry; Edited by James Salinger, M.V.K. Sivakumar, and Raymond P. Motha; Springer, Netherlands, 2005
Oil palm is best suited to a humid tropical climate in which • rain occurs mostly at night and days are bright and sunny • minimum monthly rainfall is around 1500 mm with absence of dry seasons • an evenly distributed sunshine exceeding 2000 h per year • A mean maximum temperature of about 29–33 C and a mean minimum temperature of 22–24 C favor the highest bunch production
A high mean annual temperature of 28–31 C is favorable for high production • If these higher temperatures lead to drought conditions, however, an estimated 208,000 ha of land or 12% of the present oil palm areas would be considered marginal-to-unsuitable for oil palm cultivation, particularly in drought-prone areas • Increased rainfall favors oil palm productivity unless it leads to flooding • With an anticipated sea level rise of 1 m, an estimated 100,000 ha of area, currently planted with oil palm, may be deemed unsuitable and would have to be abandoned
Effect of climate change on cocoa Yield in ton/ha/yr INCREASING CLIMATE VARIABILITY AND CHANGE: Reducing the Vulnerability of Agriculture and Forestry; Edited by James Salinger, M.V.K. Sivakumar, and Raymond P. Motha; Springer, Netherlands, 2005
Cocoa is planted in areas where annual rainfall is in the range of 1250–2800 mm • Cocoa prefers areas where annual rainfall is in the range of 1500–2000 mm and the number of dry months is three or less • It should not be planted in areas with annual rainfall below 1250 mm, unless irrigation is provided • Areas with annual rainfall exceeding 2500 mm are also not favorable as it reduces yield by 10–20% due to water logging • excessive rainfall causes high disease incidence, especially Phytophthora and pink diseases
Temperatures exceeding 32 C may result in moisture stress, leading to yield loss of 10–20% • Based on these considerations, the states that experience a distinct dry season are marginal areas for cocoa cultivation • Irrigation is required in these areas if cocoa is to be cultivated • Some areas, which register high rainfall, are not suited for cocoa cultivation due to the high incidence of diseases • This can result in yield loss of more than 20%
With climate change, a high incidence of drought is expected to reduce yield • On the other hand, excessive rainfall with reduced insolation can also result in low yields • under such wet conditions, a high incidence of fungal diseases such as vascular streak disease and black pod can depress yields
Effect of climate change on rice Yield in ton/ha/yr INCREASING CLIMATE VARIABILITY AND CHANGE: Reducing the Vulnerability of Agriculture and Forestry; Edited by James Salinger, M.V.K. Sivakumar, and Raymond P. Motha; Springer, Netherlands, 2005
Rice constitutes 98% of total cereal production in Malaysia • Generally, long periods of sunshine are favorable for high rice yields • Growth is optimal when the daily air temperature is between 24 and 36 C. The difference between day and night temperatures must be minimal during flowering and grain production
Grain yields may decline by 9–10% for each 1 C rise in temperature • If drought conditions are prolonged, the current flooded rice ecosystem can not be sustained. It may be necessary to develop non-flooded and dry land rice ecosystem to increase the level of national rice sufficiency • a threat to national food security
World’s ten largest producer of rice in 2008: • China (193.4 mil ton) • India (148.3 mil ton) • Indonesia (60.3 mil ton) • Bangladesh (46.9 mil ton) • Viet Nam (38.7 mil ton) • Myanmar (30.5 mil ton) • Thailand (30.5 mil ton) • Philippines (16.8 mil ton) • Brazil (12.1 mil ton) • Japan (11.0 mil ton) … 25. Malaysia (2.4 mil ton) 50% of world’s rice
Rice productivity by country (1961-2008) Australia and Japan: most efficient countries, but large variations year-on-year China: rapid & steady increase (2.1 to 6.6 ton/ha between 1961-2008)
Malaysia rice statistics est. 2015 2008: 0.67 mil. ha 2008: 3.6 ton/ha +0.04 ton/ha per year 2008: 2.5 mil. ton +28,300 ton per year 2008: 86.0 kg/capita -1.0 kg/capita per year est. 2015 est. 2015
Malaysia self-sufficiency levels Target: 100% self-sufficient by 2015 Possible?
Mean rice productivity increase per year +2.0% increase per year only (not 4.9% required for 100% self sufficiency by 2015)