Download
1 / 30
340 likes | 547 Views
Climate Change and Malaysia. Numerical Weather Prediction Division Malaysian Meteorological Department. Global Warming. Figure 1 : Global Averaged Surface Temperature (IPCC AR4 WG1: Physical Science Basis).

E N D
Climate Change and Malaysia Numerical Weather Prediction Division Malaysian Meteorological Department
Figure 1: Global Averaged Surface Temperature (IPCC AR4 WG1: Physical Science Basis) • Twelve of the thirteen years in the period (1995-2007) rank among the top 12 warmest years in the observation record • Global temperatures have risen by about 0.74 ºC since the beginning of the 20th century
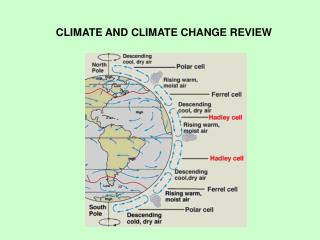
What causes weather & climate? INSOLATION [INcomingSOLAR radiATION Differential heating of the earth’s surface
Milankovitch Cycles • Variation in Internal Atmospheric Cycles (El Nino Northern Atlantic Oscillation Indian Ocean dipole etc) • Variation in Oceanic Circulations • Volcanic Eruptions
Anthropogenic Activities • Emissions of greenhouse gases & aerosols • Change in land-use • Deforestation
WEST PENINSULAR MALAYSIA (ANNUALPRECIPITATION) LANGKAWI PETALING JAYA BUTTERWORTH SUBANG
EAST PENINSULAR MALAYSIA (ANNUAL PRECIPITATION) KOTA BARU KUANTAN MERSING KUALA TRENGGANU
EAST MALAYSIA (ANNUAL PRECIPITATION) KOTA KINABALU KUCHING SANDAKAN MIRI
WEST MALAYSIA (MEAN TEMPERATURE) BUTTERWORTH KOTA BARU PETALING JAYA KUANTAN
EAST MALAYSIA (MEAN TEMPERATURE) KUCHING KOTA KINABALU SANDAKAN MIRI
1997 1977 1982 1991 1987 1972
Projected global average temperature changes for the early and late 21st century relative to the period 1980 – 1999, as calculated by multi-model averages for a low (B1), a medium (A1B) and a high SRES scenario for the decades 2020-2039 (left) and 2090-2099 (right). (IPCC, 2007)
Annual Rainfall Changes (%): Nine GCMs Ensemble Based upon 9 Global Climate Model Ensemble Projection, Temperature Increase for Peninsular Malaysia ~ 2.8°C East Malaysia ~ 2.6 °C Rainfall Variation (%) for Malaysia based upon 9 Global Climate Model Ensemble Projection
Regional Climate Simulations • Global Circulation Models (GCM) lack regional detail that impact assessment on climate change require. • A Regional Climate Model (RCM) adds small-scale detailed information of future climate change to the large-scale projections of a GCM. Coarse resolution information from a GCM is used to develop temporally and spatially fine scale information. • In the Malaysian Meteorological Department, the PRECIS (Providing Regional Climates for Impacts Studies) is being used.
Orographic Resolution PRECIS resolution 0.44° x 0.44° HadCM3 resolution 2.5° x 3.75°
PRECIS captures important regional information on summer monsoon rainfall missing in its parent GCM simulations
PRECIS Simulations of Present Climate (1961-1990) Mean Annual Cycles of SEA Rainfall and Temperature
Simulation of Average Annual Surface Temperature for Malaysia using PRECIS • 5 year running averages used
Simulation of Average Annual Rainfall for Malaysia using PRECIS • 5 year running averages used
1.3 °C 1.9°C3.1°C 1.0°C 1.7°C2.8°C 1.1°C 1.7°C2.9°C 1.2°C 1.9°C3.0°C 1.2°C 2.0°C3.4°C 1.5°C 2.0°C3.2°C 1.4°C1.9°C3.2°C 1.4°C 2.0°C3.8°C -11.3 6.411.9 -17.5 –12.8 –3.6 -18.7 -6.0 4.1 -8.9 –1.2 0.3 -10.2 2.314.1 -14.6 -0.2 15.2 -9.1 –1.36.2 Annual Mean Temperature Anomaly Relative to 1990 - 1999 Annual Mean Rainfall Anomaly (%) Relative to 1990 – 1999 2020 - 2029 2050 - 2059 2090 - 2099