Download
1 / 9
100 likes | 128 Views
Theme 4 Elementary Analysis. Babbie & Mouton, 2005. The Practice of Social Research. Cape Town: Oxford. Multivariate Analysis. Most soc. Science analysis falls within multivariate analysis (general term not a form of analysis) – examination of several variables simultaneously

E N D
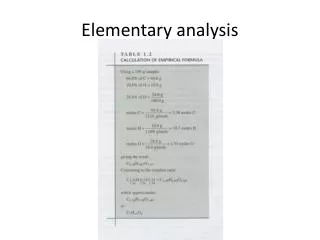
Theme 4Elementary Analysis Babbie & Mouton, 2005. The Practice of Social Research. Cape Town: Oxford
Multivariate Analysis • Most soc. Science analysis falls within multivariate analysis (general term not a form of analysis) – examination of several variables simultaneously • Techniques for conducting multivariate analysis: • Factor analysis, • Smallest-space analysis, • Multiple correlation, • Multiple regression, and • Path analysis • Basic logic of multivariate analysis is by means of contingency tables / cross-tabulations • Understand multivariate analysis by fundamental analytic modes: • Univariate analysis • Bivariate analysis
Univariate Analysis • Examination of distribution of cases on only one variable at a time (Describe units of analysis for inferring to larger population) • The logic is as follows: • Distributions– report all individual cases –listing the attributes for each case under study terms of the variable in question • Central tendency– presenting data in the form of summary averages/measures of central tendency –calculating either the mode, arithmetic mean or median (see figure 15.2 p. 425) • Dispersion– measuring the range & standard deviation–the distance separating the highest from the lowest value • Continuous & discrete variables– e.g age & military rank –nominal & ordinal variable • Detail vs manageability– two goals when reporting data
Subgroup Comparisons • Bivariate & multivariate analyses aimed at explanation • Purpose of subgroup description is comparative • Table-formatting issues: • “Collapsing” response categories – combine/collapse two ends of the range of variation e.g very good & good; very poor & poor • Handling “don’t knows”– analyse with and without as well as reporting on both – so readers can draw their own conclusions
Bivariate & Multivariate Analysis • Contrast to univariate as two variables are involved • Largely descriptive – independently describing subgroups with comparison • Adds relationships amongst the variables themselves • Thus involves describing the variables instead of the unit of analysis • Tables constructed from several variables • Reading a table can be as follows: • Read across if table is percentaged down, or • Read down if table is percentaged across • Multivariate - same as bivariate tables except we now use more tan one independent variable
Theme 4The Elaboration Model Cornel Hart March 2007
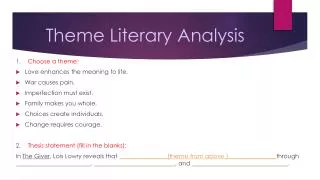
The Elaboration Model • Also known as interpretation method, Columbia school or Lazarsfeld method • Aims at elaborating on empirical relationship among variables i.o.t. interpreting that relationship • Provides clearest picture of the logic of causal analysis in research • Understanding the relationship between two variables through controlled simultaneous introduction of additional variables by means of contingency tables
Elaboration Paradigm (Table 16.5) • Technical notations –replication, explanation, interpretation & specification • Know whether the test variable is antecedent (prior in time) to the other two variables or intervening between them • Antecedent – test variable affects both the ‘independent’ & ‘dependent’ variables; are related to each other but no causal link between them (figure 16.2) • Intervening – independent variable affects the intervening test variable which in turn affects the dependent variable (figure 16.1)
Technical Notions • Replication– original relationship has been replicated among different groups with still the same result thus original relationship is genuine & general one • Explanation– spurious relationship – original relationship explained through introduction of test variable • Interpretation– Similar to explanation except for time placement of test variable & implications that follow from that difference • Specification– used regardless of whether the test variable is antecedent or intervening – have specified particular conditions under which original relationship holds • Ex Post Facto Hypothesizing - Developing a hypotheses “predicting” relationships that have already been observed – invalid science • Elaboration model provides logical tools for testing those hypotheses within the same body of data - replication