Download
1 / 6
60 likes | 140 Views
Do Spaceborne Passive Microwave Radiometer Channels See Falling Snow? Gail Skofronick-Jackson Code 613.1, NASA GSFC. Figure 1.

E N D
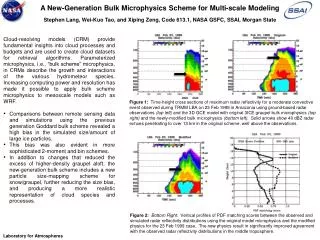
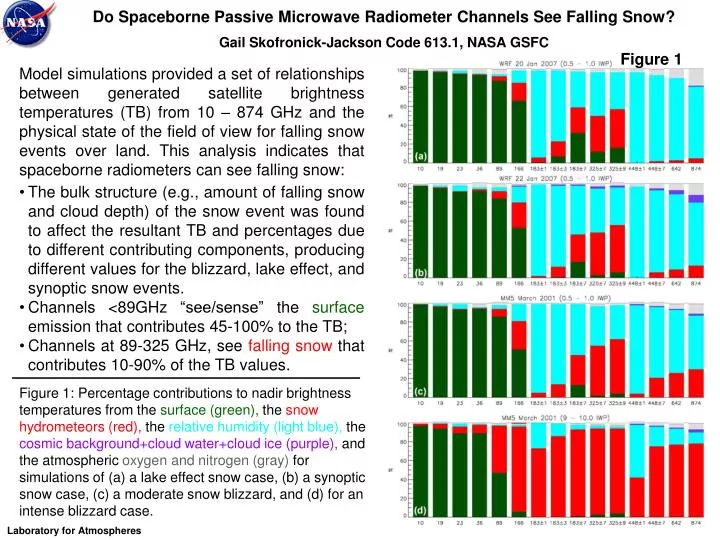
Do Spaceborne Passive Microwave Radiometer Channels See Falling Snow?Gail Skofronick-Jackson Code 613.1, NASA GSFC Figure 1 Model simulations provided a set of relationships between generated satellite brightness temperatures (TB) from 10 – 874 GHz and the physical state of the field of view for falling snow events over land. This analysis indicates that spaceborne radiometers can see falling snow: • The bulk structure (e.g., amount of falling snow and cloud depth) of the snow event was found to affect the resultant TB and percentages due to different contributing components, producing different values for the blizzard, lake effect, and synoptic snow events. • Channels <89GHz “see/sense” the surface emission that contributes 45-100% to the TB; • Channels at 89-325 GHz, see falling snow that contributes 10-90% of the TB values. Figure 1: Percentage contributions to nadir brightness temperatures from the surface (green), the snow hydrometeors (red), the relative humidity (light blue), the cosmic background+cloud water+cloud ice (purple), and the atmospheric oxygen and nitrogen (gray) for simulations of (a) a lake effect snow case, (b) a synoptic snow case, (c) a moderate snow blizzard, and (d) for an intense blizzard case. Laboratory for Atmospheres
Name: Gail Skofronick-Jackson, NASA/GSFC, Code 613.1 E-mail: Gail.S.Jackson@nasa.gov Phone: 301-614-5720 • References: • Skofronick-Jackson, G., and B. T. Johnson (2011), Surface and atmospheric contributions to passive microwave brightness temperatures for falling snow events, Journal of Geophysical Research, 116, D02213, doi:10.1029/2010JD014438. • James L. Foster, Gail Skofronick-Jackson, Huan Meng, George Riggs, Benjamin T. Johnson, James R. Wang, Dorothy K. Hall, Son V. Nghiem, “Remote Sensing of the Historic February 2010 Snow Storms in the Baltimore/Washington DC Area” Submitted to Remote Sensing of the Environ., Jan. 2011. • Data Sources: Weather Research Forecast (WRF) model simulations from Dr. Wei-Kuo Tao’s group (Code 613.1) of a 20 January 2007 lake effect snow case in Canada that deposited about 30 cm of snow in 4 hours, (b) a 22 January 2007 synoptic snow case in Canada that deposited about 6 cm snow in 12 hours, and (c, d) a Mesoscale Model (MM5) simulation of the Northeastern March 2001 snow blizzard that deposited about 75 cm snow in 24 hours. Figures a, b, and c are for profiles with Ice Water Paths (IWP) of 0.5 to 1.0 kg m-2, whereas Fig. 1d is for profiles with IWP of 9.5 to 10 kg m-2. • Technical Description of Figures: • Figure 1: Percentage contributions to nadir brightness temperatures (TBs) from the surface (green), the snow hydrometeors (red), the relative humidity (light blue), the cosmic background+cloud water+cloud ice (purple), and the atmospheric oxygen and nitrogen (gray) over IWP of 0.5 to 1.0 kg m-2 for (a) a WRF 20 January 2007 lake effect snow case, (b) a WRF 22 January 2007 synoptic snow case, (c) a MM5 March 2001 snow blizzard, and (d) for IWP of 9.5 to 10.0 kg m-2 for the March 2001 blizzard. TBs computed use non-spherical snowflake particles and radiative transfer with multiple scattering. This work complements early satellite-based retrievals of falling snow (G. M. Skofronick-Jackson, et al., “A Physical Model to Determine Snowfall over Land by Microwave Radiometry,” IEEE Trans. Geosci. Remote Sens., 2004). • Results Illustrated in Figure 1: • The low frequency channels (<89 GHz) are extremely sensitive to the land surface with > 65% contribution to the upwelling TBs. • The 183 GHz sounding channels have a large contribution from the water vapor in the profile, mostly when there is a limited quantity of profile particles. • The higher frequency channels (>= 89 GHz) are sensitive to the frozen hydrometeors in the cloud. • The amount of snow and vertical structure of an event in a bulk sense affects the TB and percentages resulting from the surface and hydrometeors. For example, as the cloud tops increase from ~3 km (lake effect, Fig. 1a) to ~6 km (synoptic, Fig. 1b) to ~9 km (blizzard, Fig. 1c) the percentage due to snow increases (for the same IWP) at the higher frequencies. Further, when you increase IWP (Fig. 1d) the contribution increases drastically. • The slant path at a 53o viewing angle (not shown) increases the percentage contributions from hydrometeors relative to nadir viewing channels. • Scientific significance: Because precipitation is a critical link in the Earth’s global water and energy cycles, there is an interest in retrieving precipitation (both rain and snow) in an accurate and consistent fashion on a global basis. Crucial for developing physically-based precipitation retrieval algorithms is an understanding of the physical relationships between satellite observations of the Earth and the state of the atmosphere and surface within the field of view. This work elucidates these relationships using a theoretical investigation. • Relevance for future science and relationship to Decadal Survey: We perform these analyses for selected frequencies ranging from 10 to 874 GHz, consistent with current (e.g., AMSR-E, TRMM, AMSU-B), planned passive microwave sensors (e.g., GPM, PATH), and proposed submillimeter radiometers (e.g., GSFC-CISSIR, ESA-CIWSIR). Due to the interest in GPM detecting falling snow, this work is most relevant for retrievals of falling snow from GPM’s Microwave Radiometer (GMI) with channels from 10 to 183 GHz. Laboratory for Atmospheres
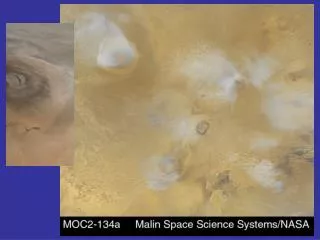
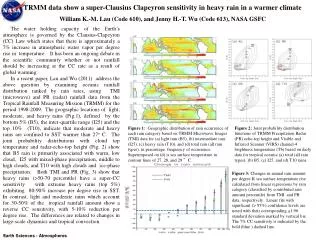
Laboratory for Atmospheres MISR Contributes to Iceland Volcano Ash Plume Safety AnalysisRalph Kahn, Code 613.2, NASA GSFC; David Nelson, Barbara Gaitley, JPL/MISR Team Iceland’s Eyjafjalljökullvolcano erupted repeatedly between 14 April and 23 May 2010, sending ash plumes across the skies of Europe, disrupting air traffic, and stranding travelers for up to several weeks. During the early eruptions, much of European airspace was shut down, but by early May, selective closures allowed many more flights to proceed, vastly reducing the impact on society. Geosynchronous instruments such as the European SEVIRI made the primary satellite contributions to the improved near-real-time response. But detailed MISR plume heights and data from other polar-orbiting satellites are playing key roles in improving ash plume modeling and prediction internationally, aimed at planning for future volcanic events. 6 4 Plume 2 2 0 km Plume 1 Figure 1: 07 May 2010 12:39 UT – The Multi-angle Imaging SpectroRadiometer (MISR) instrument aboard the NASA Earth Observing System’s Terra satellite captured the true-color, nadir-viewing image at right, along with eight other images at viewing angles ranging from +70˚ to -70˚ along a 380-km-wide ground track. Aerosol amount and type, as well as plume vertical extent and ambient wind vectors, are derived from the MISR multi-spectral, hyper-stereo observations. The image at right shows plume height derived for this event using the MINX algorithm. Two plumes appear: More than 400 km of the main plume falls within the field-of-view; it is injected to about 6 km and descends to about 3 km toward the east. Plume 2 is remobilized ash residing near-surface. The volcano itself is at the upper left in these images (see inset map in the left image).
Name: Ralph Kahn, NASA/GSFC Code 613.2 E-mail: Ralph.Kahn@nasa.gov Phone: 301-614-6193 References: Kahn, R. A., W.-H. Li, C. Moroney, D. J. Diner, J. V. Martonchik, and E. Fishbein, 2007. Aerosol source plume physical characteristics from space-based multi-angle imaging. J. Geophys. Res. 112, D11205, doi:10.1029/2006JD007647. Kahn, R.A., D.L. Nelson, B.J. Gaitley, et al., 2011. Iceland Volcano Ash Plume Extent and Properties. Atmosph. Chem. Phys., in preparation. Data Sources: MISR multi-angle radiance imaging and stereo-derived reflecting-level height Technical Description of Figures: Figure 1 : a) Nadir-view, red-green-blue image of the Eyjafjalljökull volcano and near-source plume obtained at 12:39 UT during the 07 May 2010 eruption. The inset is a map showing the MISR image coverage, which includes the volcano itself, in the upper left corner. b) Stereo-derived heights for the main plume, extending to the southeast, and a second plume of ash remobilized from the surface, advected to the southwest by near-surface winds. The horizontal resolution of the stereo-height data is 1.1 km, and the vertical resolution is about 0.5 km. A wind correction is applied to the heights shown. Scientific significance: Interest in volcanic ash plume evolution currently centers around aviation safety. More generally, the multi-angle imaging plume height mapping capability complements lidar height measurements, which are generally more sensitive to height distribution for thinner aerosol layers, but provide only a single line of data rather than regional height coverage. Relevance for future science and relationship to Decadal Survey: Near-source wildfire smoke, desert dust, and volcanic ash plume heights are key inputs to models that predict plume evolution, and aerosol impact on regional environment and global climate. The decadal survey ACE mission is slated to include a next-generation multi-spectral, multi-angle, polarimetric imager that will duplicate and enhance the MISR capabilities. Plume 1 Figure 2: The 07 May 2010 plume height data of Figure 1b, re-plotted quantitatively as a function of distance from the source for each plume. Plume 2 Height: Blue = Wind-corrected Laboratory for Atmospheres
Ozone Hole and Southern Hemisphere Circulation ChangeFeng Li, Paul Newman, Anne Douglass, Richard Stolarski, Code 613.3, NASA GSFC The Antarctic ozone hole impacts both tropospheric and stratospheric climate, particularly in summer season. We investigated climate change in 1960-2060 using a chemistry-climate model. The scientific questions we try to address are: What is the ozone hole’s role in climate change? Are circulation changes in the troposphere and stratosphere related to each other? The ozone hole significantly changes the stratospheric circulation: it strengthens the Antarctic mass downwelling by more than 1/3 and it increases the polar jet by 50% in summer. The ozone hole also strongly impacts the tropospheric circulation pattern, causing a poleward movement of the tropical jet and strengthening the jet by 25%. Circulation changes in the troposphere and stratosphere are strongly correlated. These results help us to understand and project future climate change with the expected ozone layer recovery. Antarctic Total Ozone Stratospheric Mass Flux Subpolar Jet Troposphere Lower Stratosphere Figure 1: Time series of (top) October Antarctic total ozone, (middle) Nov-Feb mean Southern Hemisphere stratospheric mass flux, and (bottom) the Nov-Feb mean subpolar zonal wind at 5 km (blue) and 16 km (green). Thick curves are 7-year running average mean. Laboratory for Atmospheres
Name: Feng Li, NASA/GSFC, Code 613.3, and UMBC/GEST E-mail: Feng.Li@nasa.gov Phone: 301-614-6052 References: Li, F., P. A. Newman, and R. S. Stolarski (2010), Relationships between the Brewer-Dobson circulation and the Southern Annular Mode during austral summer in coupled chemistry-climate model simulations, Journal of Geophysical Research, 115, D15106, doi:10.1029/2009JD012876. Data Sources: Goddard Earth Observing System Chemistry-Climate Model (GEOSCCM) simulations and NCEP reanalysis 2. Technical Description of Figures: Figure 1: The top and middle panels show high correlation between the ozone hole and the acceleration of the stratospheric mean transport circulation. The lower panel indicates that ozone hole impacts the subpolar jets in the troposphere and stratosphere. Changes in the circumpolar jets are a measure of the Southern Annular mode, a dominant circulation pattern in the troposphere. In contrast, in an experiment that does not include ozone depletion, neither the stratospheric circulation nor the Southern Annular Mode has significant trends (not shown). These model results indicate that Antarctic ozone depletion is a major driver for both the stratospheric and tropospheric climate change in the Southern Hemisphere in the last 3 decades. Scientific significance: This study has identified ozone hole’s role in driving circulation changes in the stratosphere and troposphere. These results imply that the projected ozone recovery in the latter half of this century will strongly impact future climate change. On the other hand, an enhanced stratospheric circulation will significantly affect ozone distribution in the post-CFC era. Furthermore, an accelerated stratospheric transport circulation will increase stratosphere-troposphere exchange, which would affect tropospheric air quality, for example, by bringing more stratospheric ozone into the troposphere. Thus, our research will help to understand ozone recovery and air pollution in a changing climate. Relevance for future science and relationship to Decadal Survey: Long-term high-resolution ozone measurements are needed to monitor stratospheric ozone recovery. These data will also provide valuable information to derive stratospheric circulation change. The Decadal Survey GACM mission will provide such measurements. Laboratory for Atmospheres