Download
1 / 8
80 likes | 235 Views
A New-Generation Bulk Microphysics Scheme for Multi-scale Modeling Stephen Lang, Wei-Kuo Tao, and Xiping Zeng, Code 613.1, NASA GSFC, SSAI, Morgan State.

E N D
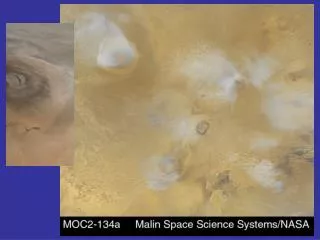
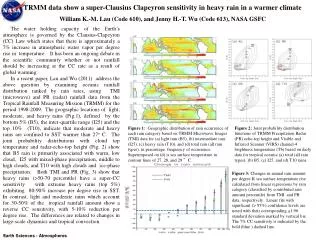
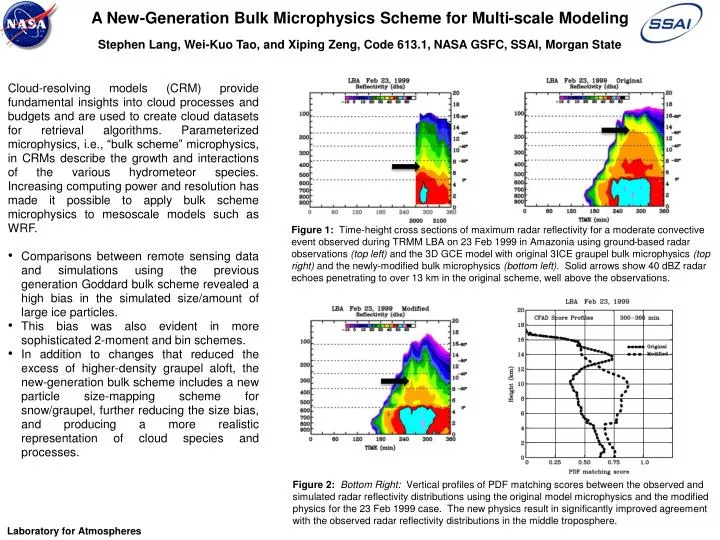
A New-Generation Bulk Microphysics Scheme for Multi-scale ModelingStephen Lang, Wei-Kuo Tao, and Xiping Zeng, Code 613.1, NASA GSFC, SSAI, Morgan State • Cloud-resolving models (CRM) provide fundamental insights into cloud processes and budgets and are used to create cloud datasets for retrieval algorithms. Parameterized microphysics, i.e., “bulk scheme” microphysics, in CRMs describe the growth and interactions of the various hydrometeor species. Increasing computing power and resolution has made it possible to apply bulk scheme microphysics to mesoscale models such as WRF. • Comparisons between remote sensing data and simulations using the previous generation Goddard bulk scheme revealed a high bias in the simulated size/amount of large ice particles. • This bias was also evident in more sophisticated 2-moment and bin schemes. • In addition to changes that reduced the excess of higher-density graupel aloft, the new-generation bulk scheme includes a new particle size-mapping scheme for snow/graupel, further reducing the size bias, and producing a more realistic representation of cloud species and processes. Figure 1:Time-height cross sections of maximum radar reflectivity for a moderate convective event observed during TRMM LBA on 23 Feb 1999 in Amazonia using ground-based radar observations (top left) and the 3D GCE model with original 3ICE graupel bulk microphysics (top right) and the newly-modified bulk microphysics (bottom left). Solid arrows show 40 dBZ radar echoes penetrating to over 13 km in the original scheme, well above the observations. Figure 2:Bottom Right: Vertical profiles of PDF matching scores between the observed and simulated radar reflectivity distributions using the original model microphysics and the modified physics for the 23 Feb 1999 case. The new physics result in significantly improved agreement with the observed radar reflectivity distributions in the middle troposphere. Laboratory for Atmospheres
Name: Stephen Lang, NASA/GSFC, Code 613.1 (SSAI) E-mail: Stephen.E.Lang@nasa.gov Phone: 301-614-6331 Reference: Lang, S., W.-K. Tao, X. Zeng and Y. Li, 2011: Reducing the biases in simulated radar reflectivities from a bulk microphysics scheme: Tropical convective systems, Journal of the Atmospheric Sciences (early online release) Data Sources: Atmospheric sounding data and ground-based radar data collected during the TRMM LBA field campaign, and Goddard Cumulus Ensemble model (GCE, a 3D cloud-resolving model or CRM) simulations. Technical Description: Figure 1:The 23 Feb 1999 TRMM LBA case was a “westerly wind-regime” case characterized by low-level westerly winds, deep-layer moisture, weak vertical wind shear, and weak to moderate but widespread convection that was not well-organized. On 23 Feb, diurnal convection became weakly organized into “transient” convective lines. The observed time-height cross section was derived from S-pol radar data around the time of a TRMM overpass. The 3D GCE model was run with a double cyclic grid of 512 x 512 horizontal points at 250-m horizontal resolution and 70 stretched vertical levels. The model was initialized from a single atmospheric sounding taken at 12:00 UTC (8 am local time) from Rebio Jaru. Convection was initiated using surface fluxes based on local observations. The original physics are based upon Rutledge and Hobbs (1983, 1984) and have 3 classes of ice (cloud ice, snow and graupel) and 2 liquid (cloud and rain). The bulk scheme assumes precipitation particles (rain, snow and graupel) follow an inverse-exponential size distribution with a fixed intercept. It produces excessive amounts of moderate density graupel that results in excessively high equivalent radar reflectivity values and ice scattering signatures. TRMM PR climatology shows 40-dBZ echoes rarely penetrate 10 km (Zipser et al. 2006). The original physics leads to a high bias in the height of 40-dBZ echoes. The ice physics were re-evaluated and modified to produce more realistic amounts of graupel in the new scheme. Also, a size mapping scheme for snow and graupel was introduced to allow particle sizes to vary according to temperature and mass. The result is much lower 40-dBZ penetrations and a significant reduction in the height bias. Figure 2: Probability density functions (PDFs) are computed at each level for the model-simulated radar reflectivities using the old and new microphysics. These are then compared with the PDFs from the observed radar data for a corresponding 60-minute time period. If the model and observed PDFs completely overlap one another at a given level, the matching score is unity. If there is zero overlap between the two, the matching score is zero. The new physics shows significantly better agreement with radar PDFs in the middle troposphere and thus a better overall distribution of reflectivities in addition to having better peak values as shown in Figure 1. Scientific Significance: Although CRMs are a powerful tool for the study and representation of convective cloud systems, if they produce simulations with a significant bias or biases, confidence in their accuracy is diminished (e.g., the relative importance or magnitude of individual precipitation processes may be off). Statistical comparisons (e.g., PDFs) with radar and satellite data provide a more rigorous (but not perfect, reflectivity depends on multiple hydrometeor species) means to evaluate their physics and identify and improve biases and thereby their overall accuracy. Relevance for future science and relationship to Decadal Survey:The 4D comprehensive cloud datasets produced from the GCE and other CRMs are a critical component in the development of retrieval algorithms for GPM, especially latent heating. Errors/biases in the microphysics can propagate into the retrievals and therefore need to be minimized. If adopted in other models (e.g., WRF, Goddard MMF), errors in the CRM microphysics will diminish their results as well.
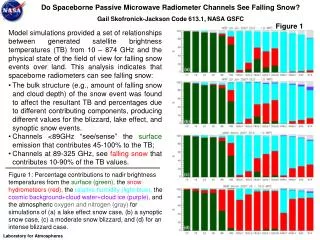
Satellite Remote Sensing of Blowing Snow Properties over Antarctica Stephen P. Palm (Code 613.1 SSAI), Y. Yang (USRA), J. Spinhirne (U of Arizona), and A. Marshak (Code 613.2 NASA-GSFC) (b) (a) • Blowing snow is a frequent and widespread phenomena over the polar regions and especially Antarctica. Blowing snow may be an important component of the mass balance of the Antarctic and Greenland ice sheets, and the water budget of high latitude regions. Account of the effects of blowing snow must be made in analysis of satellite lidar altimetry and reconstruction of paleoclimate records. This research presents a unique method to detect blowing snow from satellite lidar (ICESat and CALIPSO) and passive radiometric data (MODIS). For the first time, we describe the spatial, temporal, and physical properties of blowing snow over the entire Antarctic continent for a period of 3 years. • Blowing snow frequency in excess of 70% is seen in certain areas of East Antarctica in winter (Figure 1b) with inter-annual variability of up to 20%. • No region-wide trend was seen in blowing snow frequency (Figure 1a) • Average blowing snow layer geometric and optical thickness is 100 m and 0.20, respectively • Huge blowing snow “storms” occur frequently (2-3/week) and act to transport large quantities (>109 kg) of snow off the continent. • The high frequency of these events suggests that blowing snow storms play a substantial role in the mass balance of the Antarctic ice sheet. Figure 1: (a) The temporal distribution of blowing snow frequency over Antarctica for 3 years and (b) the spatial pattern of blowing snow frequency for 2009 (April-October). (c) MODIS CALIPSO 800 Height (m) Blowing Snow Layer 600 400 200 (d) Solid Color: 13Oct Dashed Color: 14Oct Solid Black: 15Oct Figure 2: (a) The average (April through October) attenuated backscatter profile through all blowing snow layers detected over the region [box in (d)] for 2007 through 2009. (b) The frequency distribution of blowing snow layer thickness and optical depth for the same region. (c) False color (0.85, 0.85, 2.1 μm) MODIS image and CALIPSO backscatter along track shown (yellow line). (d) Blowing snow detections during October 13 - 15, 2009. Laboratory for Atmospheres
Name: Steve Palm, NASA-GSFC, Code 613.1, and Science Systems and Applications, Inc. E-mail: stephen.p.palm@nasa.gov Phone: 301-614-6276 References: Palm, S.P., Y. Yang, J. Spinhirne and A. Marshak, 2011, Satellite remote sensing of blowing snow properties over Antarctica. Journal of Geophysical Research, Atmospheres, in press. Lenaerts, J.T.M., M. van den Broeke, S. Dery, E. van Meijgaard, W. van de Berg, S. Palm and J. Rodrigo, 2011, Modeling snowdrift in Antarctica with a regional climate model, Part I: Methods and model evaluation. Journal of Geophysical Research, Atmospheres, submitted. Palm, S.P., S. Strey, J. Spinhirne and T. Markus, 2010, Influence of Arctic sea ice extent on polar cloud fraction and vertical structure and implications for regional climate. Journal of Geophysical Research, Atmospheres, 115, D21209, doi:10.1029/2010JD013900. Data Sources: ICESat, CALIPSO, MODIS , NCEP, AMPS (Antarctic Mesoscale Prediction System) Technical Description of Figures: Figure 1: (a)The temporal distribution of blowing snow frequency over East (red points) and West (green points) Antarctica for 2007 through 2009 and (b) the spatial pattern and magnitude of blowing snow frequency over Antarctica for 2009 as derived from CALIPSO data. The inter-annual variability of blowing snow frequency shown in (a) can reach 20% in winter months over East Antarctica. This is very important for the interpretation of satellite lidar altimetry measurements as blowing snow produces a significant range bias. Blowing snow frequency can exceed 70% in certain areas of East Antarctica in winter as shown in (b). Figure 2: (a) The average (April through October) attenuated backscatter profile (from CALIPSO data) through all blowing snow layers detected over the region enclosed by the box in (d) for 2007, 2008 and 2009. (b) The frequency distribution of blowing snow layer thickness (solid line) and optical depth (dashed line) for April through October, 2009 for the same region. (c) Blowing snow detected by CALIPSO and MODIS on 14 October 2009, 06:13 UTC over East Antarctica. The blowing snow layer detected from CALIPSO data is seen immediately below the MODIS image and corresponds to the track denoted by the yellow line drawn on the MODIS image. (d) The spatial distribution of blowing snow detections from CALIPSO in the region bounded by the blue box for the period 13 -15 October 2009. The solid colored lines are detections on October 13, the dashed colored lines from October 14 and the solid black lines are the detections from October 15. This is one example of many blowing snow “storms” that were seen in the data that act to transport large quantities of snow from the continent to the ocean and sea ice. Scientific significance: These results represent the first time that blowing snow properties covering all of Antarctica have been remotely sensed from satellite. The most important findings of the study are the high frequency of blowing snow events (over 70%) in certain regions of East Antarctica during winter and the presence of very large and long-lived (2 – 4 days) blowing snow “storms” that act to transport huge quantities of snow from the continent to the surrounding sea ice and ocean. Relevance for future science and relationship to Decadal Survey: This research is very important to future NASA missions such as ICESat-II and DESDYNI because of the error (due to forward scattering) that blowing snow layers can produce in lidar altimetry measurements from space. Knowledge of the frequency, inter-annual variability, and long term trends of blowing snow are critical for assuring high quality and accurate surface elevation measurements of the Earth’s great ice sheets. Further work will include an investigation of blowing snow over sea ice, and a complete analysis of the CALISPO and ICESat data to obtain a longer historical record of blowing snow properties over both Antarctica and Greenland. Laboratory for Atmospheres
A new tool for climate research: longest single-satellite aerosol dataset is now available N. C. Hsu, C. Bettenhausen, A. M. Sayer, Code 613.2, NASA GSFC Aerosols are small particles suspended in the atmosphere. They have diverse sources, sinks, and compositions, such as desert dust (most notably from the Sahara and east Asian deserts), sea salt, urban pollution, volcanic ash, biomass burning smoke, and sulphates and organic compounds from a variety of natural and anthropogenic process. The study of aerosols is important for many reasons: 1. Their direct and indirect effects on climate are complicated and not well-quantified. 2. Poor air quality due to high aerosol loadings in urban areas has adverse effects on human health. 3. Transported aerosols provide nutrients such as iron (from mineral dust and volcanic ash), important for fertilization of parts of the world’s oceans and tropical rainforests. 4. Knowledge of aerosol loading is important to determine the potential yield from the green solar energy sources. We have developed a new aerosol dataset derived from Sea-viewing Wide Field-Of-View Sensor (SeaWiFS) measurements. The time series (1997-2010) is longer than existing records from other EOS era satellite instruments, and includes much of the strong 1997-1998 El Nino period. We include aerosol optical depth (AOD, a measure of atmospheric turbidity) in the mid-visible range of the spectrum (550 nm), and the Angstrom exponent, linked to particle size. Figure 1: Seasonal mean midvisible AOD, averaged over the SeaWiFS mission. Seasonal variability of major hotspots associated with aerosol sources such as desert dust or biomass burning is evident. Missing data are caused by persistent cloudiness, snow or ice, or darkness at the time of the SeaWiFS overpass, conditions for which aerosol retrieval is not presently possible. Figure 2: Time series of monthly average midvisible AOD over the Washington, D.C. region. A repeatable annual cycle is evident, with highest AODs during summer months due to air stagnation. Figure 3: Comparison of midvisible AOD with ground-based measurements from Aerosol Robotic Network (AERONET) island and coastal sites. The quality is high, and similar to other satellite datasets. Laboratory for Atmospheres
Name: Christina Hsu, NASA/GSFC Code 613.2E-mail: christina.hsu@nasa.govPhone: 301-614-5554 References: Hsu, N. C., S.-C. Tsay, M. D. King, J. R. Herman, Aerosol properties over bright-reflecting source regions, IEEE Trans. Geosci. Remote Sens. 42(3), 2004, doi:10.1109/TGRS.2004.824067 Hsu, N. C., S.-C. Tsay, M. D. King, J. R. Herman, Deep Blue Retrievals of Asian Aerosol Properties During ACE-Asia, IEEE Trans. Geosci. Remote Sens. 44(11), 2006, doi:10.1109/TGARS.2006.879540 Fischer, E.V., N. C. Hsu, D. A. Jaffe, M.-J. , Jeong, and S. L. Gong, A decade of dust: Asian dust and springtime aerosol load in the U.S. Pacific Northwest, Geophys. Res. Lett., 36, 2009, doi:10.1029/2008GL036467 Sayer, A. M., N. C. Hsu, C. Bettenhausen, A. Smirnov, G. E. Thomas, J. Zhang, SeaWiFS Ocean Aerosol Retrieval (SOAR): algorithm, validation, and comparison with other datasets, J. Geophys. Res., to be submitted (July 2011). Data Sources: SeaWiFS level 2 and 3 aerosol products, AERONET aerosol optical depth data. Technical Description of Figures: Figure 1:Seasonal mean AOD at 550 nm, averaged over the SeaWiFS mission, produced from daily aggregated aerosol fields at 1° latitude/longitude resolution from retrievals passing quality control tests. Seasonal variability of major aerosol sources such as desert dust or biomass burning is evident. Missing data are caused by persistent cloudiness, snow or ice, or darkness at the time of the SeaWiFS overpass, conditions for which aerosol retrieval is not presently possible. This reinforces current understanding about the variability of major global aerosol sources and transport patterns, and provides an additional dataset, independent of those others currently used (e.g. MODIS, MISR, (A)ATSR, POLDER) for aerosol analysis. Figure 2:Time series of monthly average AOD at 550 nm over the Washington, D.C. region. Created from averaging daily means of all successful aerosol retrievals within 2°latitude/longitude of Washington, D. C. Due to air stagnation, the build-up of air pollution particles occurs frequently over the summer months. There also appears to be a downward trend in aerosol loading over the D. C. area at least in the past four years. The SeaWiFS time series is longer than other currently-available single-sensor aerosol datasets. Satellites are able to provide such time series for almost any global location, while ground measurements are spatially sparser. Gaps are due to cloudiness (during which no retrieval is possible, from similar satellite or ground-based instruments) or temporary instrument failure (early 2008). Figure 3: Comparison of midvisible AOD with ground-based measurements from Aerosol Robotic Network (AERONET) island and coastal sites. The comparison includes 8,922 spatially (within 25 km) and temporally (within 30 minutes) collocated pairs of data, from 49 different sites. The quality is high (correlation of 0.85, typical uncertainty 0.03 + 15%, average bias -0.015), and similar to other satellite datasets. This demonstrates that the data are quantitatively useful for scientific applications. Scientific significance: There remains a high level of uncertainty on the global aerosol burden (both in terms of AOD and composition), and the SeaWiFS sensor provides another high-quality well-calibrated dataset for aerosol studies. Intercomparisons with other satellite and model datasets enable improvements in both through identification of reasons for differences, and improved confidence in results when results are consistent and understood. This will contribute to improved knowledge of aerosol effects on climate, and the 13-year time series provides an important piece of puzzles for estimating long-term trends in aerosol. Relevance for future science and relationship to Decadal Survey: Current (e.g. MODIS, MISR) and future sensors (e.g. NPP VIIRS, ACE) benefit from the knowledge of algorithm function and aerosol properties gleaned from the development and application of this data. Application of similar algorithms to future sensors will enable long-term aerosol records, crucial for understanding trends in aerosol loading and radiative forcing. SeaWiFS is important in this regard as the late-1997 start predates the well-used MODIS and MISR sensors (data available from early 2000). Laboratory for Atmospheres
A-train observations of Nabro (Eritrea) eruption on June 13-16, 2011 Nickolay Krotkov, Code 613.3, NASA GSFC, Kai Yang (ESSIC), Simon Carn (MTU) Marking the 20th anniversary of the eruption of Mt. Pinatubo in 1991 Eritrea’s Nabro volcano began erupting unexpectedly on June 12th. We ran advanced SO2 retrievals on the Nabro’s volcanic plume using hyperspectral UV measurements made by Ozone Monitoring Instrument (OMI) onboard NASA Aura spacecraft on June 13. Peak SO2column amounts retrieved in the volcanic cloud (> 2000 Dobson Units) are the highest SO2 columns ever retrieved from space (Fig. 1). Aqua/MODIS image shows white volcanic plume above low level meteorological clouds. The white color can be explained by high water content and predominantly reflecting particles (e.g., sulfate aerosols). The new OMI algorithm retrieves SO2 altitude, mostly between 9 and 15 km. Microwave Limb Sounder (MLS), also on Aura, has been tracking the Nabro’sSO2clouds with peak altitudes at ~100 hPa. In the few days the volcanic clouds were advected with subtropical jet stream winds over central Asia reaching as far as China (Fig. 2). Nabrocontinues to emit SO2 so it's possible that the total SO2 production may be up to 2 Tg. This makes the Nabro eruption among the largest SO2 emissions in the tropics since Pinatubo (~20 Tg). Although other recent tropical eruptions (e.g., Sierra Negra (Galapagos) in 2005, some Nyamuragira (DR Congo) eruptions) have produced comparable SO2 loadings, the Nabro emissions have reached higher altitudes (up to at least 19 km according to CALIPSO space lidar), where resulted sulfate aerosols could stay long enough to produce a measurable climatic perturbation. Figure 1: OMI column SO2 amounts in Dobson Units (1 DU = 2.69*1016 molecules/cm2, note logarithmic scale). Red color corresponds to SO2 amounts over 2000 DU. The total SO2 mass plume is estimated ~1.3 Tg, which is a lower limit as part of the proximal plume was not measured due to the OMI row anomaly. Background: Aqua - MODIS natural-color image confirms high water content of the plume Figure 2: MLS measurements of enhanced SO2 concentration (mixing ratios, ppbv) in advected Nabro volcanic clouds over Central Asia on June 16. The SO2 enhancements were measured at ~100 hPa. Laboratory for Atmospheres
Name: Nickolay Krotkov, NASA/GSFC, Code 613.3 E-mail: Nickolay.A.Krotkov@nasa.gov Phone: 301-614-5553References: Images courtesy to Simon Carn (Michigan Technological University) OMI iterative spectral fitting (ISF) retrievals: Yang, K., Xiong Liu , P.K. Bhartia , Nickolay Krotkov , Simon Carn , Eric Hughes , Arlin Krueger , Robert Spurr , Samuel Trahan (2010), Direct Retrieval of Sulfur Dioxide Amount and Altitude from Spaceborne Hyper-spectral UV Measurements: Theory and Application, Journal of Geophysical Research, 115, D00L09, doi:10.1029/2010JD013982 http://www.agu.org/journals/jd/jd1018/2010JD013982/2010JD013982.pdf Data Sources: Figure 1: NASA Aqua Moderate Resolution Imaging Spectroradiometer ( MODIS) RGB radiance data (background) and the Dutch/Finnish Ozone Monitoring Instrument (OMI) off-line volcanic SO2 data [Yang et al 20 The OMI instrument is on board of NASA Aura satellite. Both Aqua and Aura are part of NASA “A-train” formation of satellites allowing for near simultaneous co-located observations. Figure 2: Aura MLS standard SO2 data: http://disc.sci.gsfc.nasa.gov/Aura/data-holdings/MLS/ml2so2.003.shtml MLS can only measure significantly enhanced concentrations above nominal background such as that from volcanic injections. Technical Description of Figures: Figure 1: The false color polygons show burdens of volcanic sulfur dioxide (SO2) gas emitted by explosive eruption of Nabro volcano, as observed by the Dutch/Finnish Ozone Monitoring Instrument (OMI) on NASA’s Aura spacecraft. Shown are new data from advanced Iterative spectral Fitting (ISF) algorithm that is more accurate for high SO2 burdens compared to the operational algorithm. Sulfur dioxide is measured here in Dobson Units (note logarithmic scale): The greatest concentrations appear in red; the lowest in lavender. Typically used to measure ozone, the Dobson Unit is the number of molecules of gas that would be required to create a layer 0.01 millimeters thick at a temperature of 0 degrees Celsius and a pressure of 1 atmosphere. We have no validation of these extreme SO2 columns, but fitting errors and simultaneously retrieved ozone amounts all indicate the accuracy about 5%. Background: MODIS natural color image, showing bright white narrow Nabro plume containing large amounts of condensed water vapor and small reflecting aerosols above meteorological clouds: http://earthobservatory.nasa.gov/NaturalHazards/view.php?id=51045 More details about this eruption and accompanying earthquakes can be seen from: http://earthquake-report.com/2011/07/01/unusual-series-of-moderate-volcanic-earthquakes-in-eritrea-and-ethiopia/ Figure 2: MLS measurements of the SO2 mixing ratio at pressure level ~100hPa on June 16. The selected pressure level is close to the sub-tropical atmospheric tropopause region where strong westerly jet stream winds quickly advected Nabro’s volcanic plume thousands of kilometers Eastward to China. Scientific significance: If a volcano near the equator injects a sufficient quantity of sulfur dioxide into the stratosphere, the resulting chemical reactions create reflective aerosols that linger for months or even years, cooling climate by reflecting sunlight. At 13 degrees North of the equator, high altitude plume (>15km) and larger emitted SO2 amount (> 1 Tg) Nabro’s eruption could have measurable climatic perturbation. By July 2011 Nabro had cumulatively emitted 5 to 10 percent of what was released by Mount Pinatubo in 1991 (~20 Tg). Relevance for future science and relationship to Decadal Survey: Aura OMI will continue monitoring volcanic and anthropogenic SO2 from space to detect trends in volcanic and anthropogenic aerosol precursors to provide an overlap with ESA Sentinel-5 precursor mission (TropOMI) planned to launch in 2014. NASA/NOAA Ozone Monitoring and Profiling Suite (OMPS) instrument is slated for the NPP launch in 2011 and subsequent JPSS satellites. OMPS will continue the total ozone and SO2 observational record. Decadal Survey recommended the Geostationary Coastal and Air Pollution Events (GEO-CAPE) mission is planned to launch after 2020. It will allow more frequent monitoring of volcanic and anthropogenic SO2 pollution over America. Laboratory for Atmospheres