Download
1 / 1
10 likes | 97 Views
Rutgers Intelligent Transportation Systems (RITS) Laboratory Department of Civil & Environmental Engineering. A Microscopic Simulation Study of Automated Headway Control of Buses on the Exclusive Bus Lane on the Lincoln Tunnel Corridor.

E N D
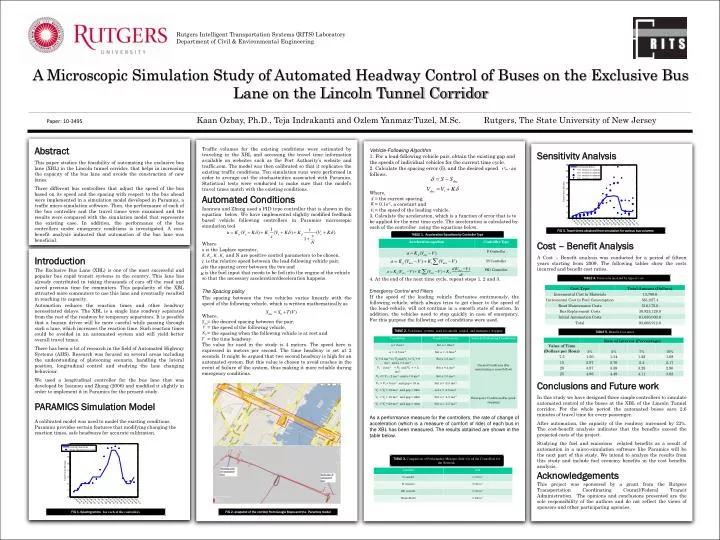
Rutgers Intelligent Transportation Systems (RITS) Laboratory Department of Civil & Environmental Engineering A Microscopic Simulation Study of Automated Headway Control of Buses on the Exclusive Bus Lane on the Lincoln Tunnel Corridor Paper: 10-3495Kaan Ozbay, Ph.D., Teja Indrakanti and Ozlem Yanmaz-Tuzel, M.Sc. Rutgers, The State University of New Jersey Abstract This paper studies the feasibility of automating the exclusive bus lane (XBL) in the Lincoln tunnel corridor, that helps in increasing the capacity of the bus lane and avoids the construction of new lanes. Three different bus controllers that adjust the speed of the bus based on its speed and the spacing with respect to the bus ahead were implemented in a simulation model developed in Paramics, a traffic micro-simulation software. Then, the performance of each of the bus controller and the travel times were examined and the results were compared with the simulation model that represents the existing case.In addition, the performance of the bus controllers under emergency conditions is investigated. A cost-benefit analysis indicated that automation of the bus lane was beneficial. Traffic volumes for the existing conditions were estimated by traveling in the XBL and accessing the travel time information available on websites such as the Port Authority’s website and traffic.com. The model was then calibrated so that it replicates the existing traffic conditions. Ten simulation runs were performed in order to average out the stochasticities associated with Paramics. Statistical tests were conducted to make sure that the model’s travel times match with the existing conditions. Automated Conditions Iaonnou and Zhang used a PID type controller that is shown in the equation below. We have implemented slightly modified feedback based vehicle following controllers in Paramics microscopic simulation tool Where s is the Laplace operator, and N are positive control parameters to be chosen, is the relative speed between the lead-following vehicle pair, is the spacing error between the two and is the fuel input that needs to be fed into the engine of the vehicle so that the necessary acceleration/deceleration happens. The Spacing policy The spacing between the two vehicles varies linearly with the speed of the following vehicle, which is written mathematically as Where, = the desired spacing between the pair, = the speed of the following vehicle, = the spacing when the following vehicle is at rest and = the time headway. The value for used in the study is 4 meters. The speed here is expressed in meters per second. The time headway is set at 2 seconds. It might be argued that two second headway is high for an automated system. But this value is chosen to avoid crashes in the event of failure of the system, thus making it more reliable during emergency conditions. . Vehicle-Following Algorithm 1. For a lead-following vehicle pair, obtain the existing gap and the speeds of individual vehicles for the current time cycle. 2. Calculate the spacing error (δ), and the desired speed ( ) as follows. Where, = the current spacing, = 0.1s-1, a constant and = the speed of the leading vehicle. 3. Calculate the acceleration, which is a function of error that is to be applied for the next time cycle. The acceleration is calculated by each of the controller using the equations below. 4. At the end of the next time cycle, repeat steps 1, 2 and 3. Emergency Control and Filters If the speed of the leading vehicle fluctuates continuously, the following vehicle, which always tries to get closer to the speed of the lead-vehicle, will not continue in a smooth state of motion. In addition, the vehicles need to stop quickly in case of emergency. For this purpose the following set of conditions were used. As a performance measure for the controllers, the rate of change of acceleration (which is a measure of comfort of ride) of each bus in the XBL has been measured. The results obtained are shown in the table below. Sensitivity Analysis Cost – Benefit Analysis A Cost – Benefit analysis was conducted for a period of fifteen years starting from 2009. The following tables show the costs incurred and benefit cost ratios. Conclusions and Future work In this study we have designed three simple controllers to simulate automated control of the buses at the XBL of the Lincoln Tunnel corridor. For the whole period the automated buses save 2.6 minutes of travel time for every passenger. After automation, the capacity of the roadway increased by 23%. The cost-benefit analysis indicates that the benefits exceed the projected costs of the project. Studying the fuel and emissions related benefits as a result of automation in a micro-simulation software like Paramics will be the next part of this study. We intend to analyze the results from this study and include fuel economy benefits in the cost benefits analysis. Acknowledgements This project was sponsored by a grant from the Rutgers Transportation Coordinating Council/Federal Transit Administration. The opinions and conclusions presented are the sole responsibility of the authors and do not reflect the views of sponsors and other participating agencies. FIG 3. Travel times obtained from simulation for various bus volumes TABLE 1. Acceleration Equations by Controller Type Introduction The Exclusive Bus Lane (XBL) is one of the most successful and popular bus rapid transit systems in the country. This lane has already contributed in taking thousands of cars off the road and saved precious time for commuters. This popularity of the XBL attracted more commuters to use this lane and eventually resulted in reaching its capacity. Automation reduces the reaction times and other headway necessitated delays. The XBL is a single lane roadway separated from the rest of the roadway by temporary separators. It is possible that a human driver will be more careful while passing through such a lane, which increases the reaction time. Such reaction times could be avoided in an automated system and will yield better overall travel times. There has been a lot of research in the field of Automated Highway Systems (AHS). Research was focused on several areas including the understanding of platooning scenario, handling the lateral position, longitudinal control and studying the lane changing behaviour. We used a longitudinal controller for the bus lane that was developed by Ioannou and Zhang (2006) and modified it slightly in order to implement it in Paramics for the present study. PARAMICS Simulation Model A calibrated model was used to model the existing conditions. Paramics provides certain features that modifying changing the reaction times, safe headways for accurate calibration. TABLE 4. Total costs incurred by type of cost TABLE 2. Non linear systems used for smooth control and emergency stopping TABLE 5. Benefit-Cost ratios TABLE 3. Comparison of Performance Measure (Jerk) for all the Controllers for the Network. FIG 1. Spacing errors for each of the controllers FIG 2. snapshot of the corridor from Google Maps and the Paramics model