Download
1 / 41
410 likes | 414 Views
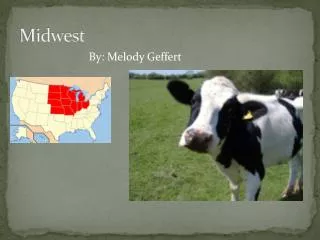
Midwest Research Institute. Solutions through science and technology. Fine Fraction of Particulate Matter in Fugitive Dust. Funding Organization Western Regional Air Partnership Duane Ono. Performing Organization Midwest Research Institute Chatten Cowherd, Ph.D.

E N D
Midwest Research Institute Solutions through science and technology Fine Fraction of Particulate Matter in Fugitive Dust Funding Organization Western Regional Air Partnership Duane Ono Performing Organization Midwest Research Institute Chatten Cowherd, Ph.D
Fugitive Dust Emissions • Highly fluctuating plume impacts at emission measurement site • PM concentrations vary from background to plume core values • Emissions depend on energy inputs and properties of emitting surface material
AP-42 Emission Factors • Predictive equations with particle size multipliers • Historically, particle size multipliers based on data from high-volume cyclone/cascade impactors • Potential for particle size bias in overpredicting fine fractions
Discrepancy in Fine Fraction Data • Emission data from the high-volume cyclone/impactor system have provided the basis for a PM2.5/PM10 of ~0.20 for many fugitive dust sources in EPA’s AP-42 • Ambient air monitoring data suggest that PM2.5/PM10 may be less than 0.10
MRI Cyclone/Cascade Impactor System
Plume Characterization Options • Field studies produce highly variable results because of wind variations • Laboratory exposure chambers can produce nearly steady-state conditions • Confounding factors can be reduced in controlled laboratory flow settings
EPA Field Study in 1990s • Purpose to resolve fine fraction emission biases for paved and unpaved roads • Geographic distribution of test sites • Cyclone/Impactor biases evident • New AP-42 fine fractions were averages between cyclone/impactor and dichotomous sampler results
Revisions to AP-42 Fine Fractions • PM2.5/PM10 ratio for unpaved roads (dominated by fugitive dust) was reduced from 0.26 to 0.15 • PM2.5/PM10 ratio for paved roads was reduced from 0.46 to 0.25 • Non-dust component of paved road emissions assigned a PM2.5/PM10 ratio of 0.76, accounting for vehicle exhaust and brake and tire wear
Purpose of Controlled Lab Study • Collect new controlled data from collocated reference PM monitors with MRI high-volume cyclone/impactor system • Determine extent of any bias in the PM2.5/PM10 ratio as determined by the cyclone/impactor system
Looking through tunnel toward Inlet flow straighteners
Viewing Window with Continuous PM Mass Monitor
Phase I Testing • Purpose: Determine potential bias in PM-2.5 concentration as measured by cyclone/impactor system • RFM: Partisol Model 2000 for PM-2.5 • Test materials: ISO 12103-1 Arizona Test Dusts—fine and coarse grades; Owens Dry Lake surface soil
Unit Sampler Manufacturer/ model Flow rate Particle size cutpoint 2 Cyclone pre-separators Sierra Model 230 CP 20 acfm 10.2 μmA 2 Multistage impactor Sierra Model 230 20 acfm 2.1 μmA 2 Partisol R&P Model 2000 16.7 alpm 2.5 μmA 2 DustTRAK TSI Model 8520 5 alpm 2.5 μmA and 10 μmA Air Samplers: Phase I
MRI Cyclone for Sampling of PM-10 in Fugitive Dust
Exposure Chamber with Sampler Inlets
Phase II Testing • Purpose: Determine PM-2.5/PM-10 ratios for a variety of western surface materials • RFMs: Partisol Model 2000 for PM-2.5 and PM-10 • Test materials: Soils, aggregates, and unpaved road surface materials • Aerosolization system: Constant flow energy
Unit Sampler Manufacturer/model Flow rate Particle size cutpoint 2 Partisol R&P Model 2000 16.7 alpm 2.5 μmA 2 Partisol R&P Model 2000 16.7 alpm 10 μmA 2 DustTRAK TSI Model 8520 5 alpm 2.5 μmA and 10 μmA. Air Samplers: Phase II
Contributors of Test Samples • Great Basin UAPCD—Owens Dry Lake • CH2MHill—Salton Sea • WY AQD—Thunder Basin mine • NM AQB—South central New Mexico • Alaska DEC—Matanuska Valley • Arizona DEQ—Maricopa & Pima Counties
Wind Erodibility Groups • WEG values developed by USDA/NRCS to indicate the susceptibility of surface soil to blowing (Nine WEG values) • Soil blowing correlated with: • Soil texture • Organic matter content • Effervescence due to carbonate reaction with HCl • Rock and pararock fragment content • Mineralogy • Soil moisture and frozen soil
PM-10 Emission Categories vs. Wind Erodibility Groups • 1 – Silty Sand & Clay (WEG 4 and 5) • 2 – Sandy Silt (WEG 2 and 3) • 3 – Loam (WEG 4L) • 4 – Sand (WEG 1) • 5 – Silt (WEG 6 and 7) Note: USDA provides national soil database (SSURGO) with WEG values for GIS analysis.
Results of Controlled Wind Tunnel Study • PM2.5 concentrations measured by the high-volume cyclone/impactor were factor-of-2 higher than measured by reference-method samplers. • Geometric mean bias of 2.01 • Arithmetic mean bias of 2.15
Comparability of Field and Laboratory Test Results • PM2.5 bias of cyclone/impactor system • Measured under controlled laboratory conditions • Closely replicated by the bias observed in the prior EPA-funded field study • Both studies used reference method samplers for comparison
Reporting Process • Test Plan--with opportunity to observe laboratory wind tunnel facility • Draft Test Report--with independent peer reviewers • Comment/Response Log--for each review comment • Revised Test Report
Recommended AP-42 Fine Fractions • Paved Roads [13.2.1] • Unpaved Roads (Public & Industrial) [13.2.2] • Construction & Demolition [13.2.3] • Aggregate Handling & Storage Piles [13.2.4] • Industrial Wind Erosion [13.2.5] • Agricultural Tilling • Open Area Wind Erosion
Paved Roads • Current PM2.5/PM10 Ratios • Dust component: 0.25 • Non-dust component: 0.76 • Proposed Change • Dust component: 0.15 • Justification • Factor of 2 bias in cyclone/impactor data
Unpaved Roads • Current PM2.5/PM10 ratio: 0.15 • Proposed PM2.5/PM10 ratio: 0.1 • Justification • Controlled wind tunnel test results • Field test results
Construction & Demolition • AP-42 recommends referring to other sections (e.g., unpaved roads) • Category emissions normally dominated by travel over unpaved surfaces • Proposed PM2.5/PM10 ratio: 0.1 (ref. earlier justification) • Large cleared areas possible significant source of wind erosion (ref. section on open area wind erosion)
Aggregate Handling and Storage Piles • Open storage pile emissions usually dominated by traffic on unpaved surfaces around piles • Proposed PM2.5/PM10 ratio: 0.1 (ref. earlier justification) • Proposed PM2.5/PM10 ratio for transfer operations: 0.15 (justification based on factor-of-two bias in cyclone/impactor system)
Industrial Wind Erosion • Examples include open tailings piles or raw material storage piles • Proposed PM2.5/PM10 ratio: 0.15 • Justification based on • Controlled wind tunnel test results • Prior tests with portable wind tunnel
Agricultural Tilling • Original AP-42 section “under review” • WRAP Handbook recommends PM2.5/PM10 ratio of 0.2 • Ratio of 0.2 consistent with controlled wind tunnel results, considering lower plume concentrations generated by slow moving implements
Open Area Wind Erosion • Examples are disturbed soils such as agricultural fields • Prior portable wind tunnel tests show ratios in the range of 0.3 • Proposed PM2.5/PM10 ratio: 0.15 • Justification: • Factor-of-two bias in C/I system • Owens Lake plume data
Conclusions • Tested materials showed consistent particle size characteristics under constant energy input • Tests results consistent with prior field study • Sound basis for proposed revisions to PM2.5/PM10 ratios in AP-42