Download
1 / 38
380 likes | 539 Views
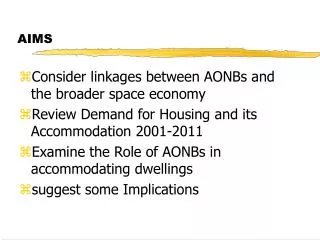
AIMS. Consider linkages between AONBs and the broader space economy Review Demand for Housing and its Accommodation 2001-2011 Examine the Role of AONBs in accommodating dwellings suggest some Implications. Contemporary Economy: Attenuated Linkages.

E N D
AIMS Consider linkages between AONBs and the broader space economy Review Demand for Housing and its Accommodation 2001-2011 Examine the Role of AONBs in accommodating dwellings suggest some Implications
Contemporary Economy: Attenuated Linkages Valued Landscapes imply Residential Desirability and demand pressure in many AONBs
Community Types Many AONBs provide homes to high status households supplying labour to a broad range of employment centres (shown in purple)
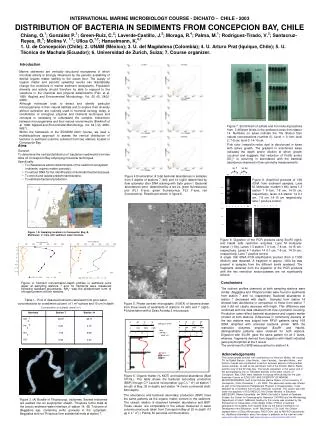
Economic Mass (10km) The number of persons living within 10kms of any point serves as a proxy for economic mass A contour of average economic mass lies where the palaest pink meets the green shade;areas with lowest economic mass being shown in blue. Low economic mass implies lower development pressure
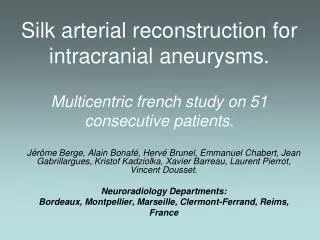
Implied Travel Distance & AONBs It is possible to model the average distance which people will travel to work from any point on the basis of opportunities at different distances away and other factors including whether the home is in an AONB The shortest modelled distances are shown in purple ranging through oranges to the longest in deep brown. Of course, actual travel distances differ from these expectations. Overlaid reds show where people travel further than expectation; overlaid blues show places from which they travel less far
Travel Distance & AONBs Red divergences indicates longer than expected travel distances-indicative of high residential desirability
Household Growth & Its Accommodation Demand driven by falling household size single living greater longevity dependent upon long-run growth in real income
Household Growth & its Accommodation Supply response housebuilders castigated by Barker planning system also castigated Prices rise but demand is not entirely choked off within the market varying adaptive responses bring forth dwelling units of various types
Change in Dwelling Stock:England; 2001-2011 Patterns of change can be examined by comparing dwellings to which Royal Mail deliver latters 1.85 M Additional Dwellings Accommodated in England (1.95M E&W) Three Fifths accommodated in Urban Areas (10,000+) Stock grew by 8.8% Marked growth of dwellings away from isolated farmsteads, hamlets, villages or larger settlements
Change in Dwelling Stock:2001-2011 Intensity of shading
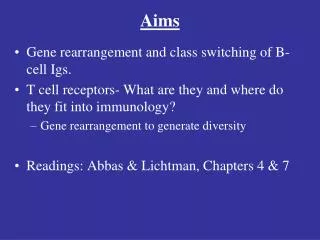
Change in Dwelling Stock:AONBs; 2001-2011 Accommodate an Additional 44,000 Dwellings Represents 2.3% of Addition in England and Wales Stock Grew by 9.8% 20,000 extra dwellings ‘nowhere’ Density of dwellings in AONBs grew by 2.2 units per sq km
Comparing Patterns of Accommodation 2001-2011 • Use Overall Increase in Ambient Dwelling Density across an area: • in AONBs: 2.2 extra dwellings per sq km • in Buffer: 7.8 extra dwellings per sq km
Comparing Patterns of Accommodation 2001-2011 • But if we consider only non-town rural • AONBs overall: 2.2 extra dwellings per sq km • nt rural Buffe: 2.4 extra dwellings per sq km
Comparing Patterns of Accommodation 2001-2011 • What about increase in ambient density due to dwellings away from settlement? • in AONBs: 1.0 extra dwellings per sq km • in Buffer: 0.5 extra dwellings per sq km
So how are dwellings actually accommodated in AONBs? • Contribution to increase in ambient density per sq km • dwellings away from settlement 1.0 • all other dwellings 1.2
So how are dwellings actually accommodated in AONBs? • Clusters of 50+ units: 9,500 • All other settings 34,500 • Total 44,000
Pareto, Peapods and Planning • Vilfredo Pareto noticed that 20% of the pea-pods in his garden yielded 80% of the peas • In many cases 80% of effects flow from 20% of causes • This is the Pareto Principle or the 80:20 Rule • It often serves to focus attention and guide effort • But the figures above show that accommodation of dwellings in AONBS IS NOT SUCH A CASE
1) What is it to be Strategic? • Is it to consider only the larger developments (thereby ignoring not only most developments but the largest portion of aggregate development?)
1) What is it to be Strategic? • Or is it to reduce uncertainty by • actually taking account of the nature of the forces for change in AONBs and charting the progress more clearly • clarifying the manner and circumstances in which additional dwellings matter to AONBs through discussion and debate within the AONB community • ensuring that agrreed understandings and approaches are shared with LPAs
2) Don’t Allow Panic and Denial • Startling household growth in some AONBs reflects demand pressure which can assist in achieving high quality schemes • Recognize that planners tend to deny the significance of scattered development against overwhelming evidence • Accept that the 80:20 rule does not apply to rural development • Engage with clearly demonstable market-driven trends, harnessing and moderating them rather than denying them
3) Policy and Implementation • Recognize that engaging with physical development in AONBs in its actual forms demands planning policy which applies to small-scale devlopment • Recognize that implementation demands that officers and members of LPAs recognize at the point of decision that the 80:20 rule does not apply