Download
1 / 13
140 likes | 749 Views
Acceptance Sampling. Outline Sampling Some sampling plans A single sampling plan Some definitions Operating characteristic curve. Necessity of Sampling. In most cases 100% inspection is too costly. In some cases 100% inspection may be impossible.

E N D
Acceptance Sampling Outline • Sampling • Some sampling plans • A single sampling plan • Some definitions • Operating characteristic curve
Necessity of Sampling • In most cases 100% inspection is too costly. • In some cases 100% inspection may be impossible. • If only the defective items are returned, repair or replacement may be cheaper than improving quality. But, if the entire lot is returned on the basis of sample quality, then the producer has a much greater motivation to improve quality.
Some Sampling Plans • Single sampling plans: • Most popular and easiest to use • Two numbers n and c • If there are more than c defectives in a sample of size n the lot is rejected; otherwise it is accepted • Double sampling plans: • A sample of size n1 is selected. • If the number of defectives is less than or equal to c1 than the lot is accepted. • Else, another sample of size n2 is drawn. • If the cumulative number of defectives in both samples is more than c2 the lot is rejected; otherwise it is accepted.
Some Sampling Plans • Sequential sampling • An extension of the double sampling plan • Items are sampled one at a time and the cumulative number of defectives is recorded at each stage of the process. • Based on the value of the cumulative number of defectives there are three possible decisions at each stage: • Reject the lot • Accept the lot • Continue sampling
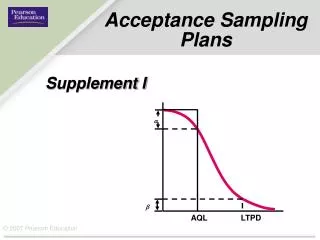
Some Definitions • Acceptable quality level (AQL) Acceptable fraction defective in a lot • Lot tolerance percent defective (LTPD) Maximum fraction defective accepted in a lot • Producer’s risk, Type I error = P(reject a lot|probability(defective)=AQL) • Consumer’s risk, Type II error = P(accept a lot| probability(defective)=LTPD)
A Single Sampling Plan Consider a single sampling plan with n = 10 and c = 2 • Compute the probability that a lot will be accepted with a proportion of defectives, p = 0.10 • If a producer wants a lot with p = 0.10 to be accepted, the sampling plan has a risk of _______________ • This is producer’s risk, and AQL = 0.10
A Single Sampling Plan • Compute the probability that a lot will be accepted with a proportion of defectives, p = 0.30 • If a consumer wants to reject a lot with p = 0.30, the sampling plan has a risk of _____________ • This is consumer’s risk, and LTPD = 0.30
Approximation to Binomial Distribution Under some circumstances, it may be desirable to obtain and by an approximation of binomial distribution • Poisson distribution: When p is small and n is moderately large (n>25 and np<5) • Normal distribution: When n is very large, np(1-p)>5
{ 0.80 0.60 0.40 0.20 { 0.20 0.18 0.02 0.04 0.06 0.08 0.10 0.12 0.14 0.16 Operating Characteristic Curve 1.00 1-a = 0.05 OC curve for n and c Probability of acceptance, Pa b = 0.10 Percent defective AQL LTPD
Example: Samples of size 50 are drawn from lots 200 items and the lots are rejected if the number of defectives in the sample exceeds 4. If the true proportion of defectives in the lot is 10 percent, determine the probability that a lot is accepted using a. The Poisson approximation to the binomial b. The normal approximation to the binomial
Example: Samples of size 50 are drawn from lots 200 items and the lots are rejected if the number of defectives in the sample exceeds 4. If the true proportion of defectives in the lot is 10 percent, determine the probability that a lot is accepted using a. The Poisson approximation to the binomial b. The normal approximation to the binomial