Download
1 / 33
340 likes | 612 Views
Beyond direct radiative forcing. Heald et al. 2013 ACPD Ashley Pierce Aerosol seminar, February 24th. outline. Aerosols and climate change IPCC on aerosols Direct Radiative Effect vs. Direct Radiative Forcing Model: assumptions & simulations Results Uncertainties and feedbacks

E N D
Beyond direct radiative forcing Heald et al. 2013 ACPD Ashley Pierce Aerosol seminar, February 24th
outline • Aerosols and climate change • IPCC on aerosols • Direct Radiative Effect vs. Direct Radiative Forcing • Model: assumptions& simulations • Results • Uncertainties and feedbacks • Larger picture http://www.c2sm.ethz.ch/research/hoose.jpg?hires
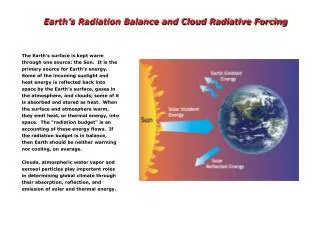
aerosols and climate change • Direct cooling: • Scatter radiation • Indirect cooling: • Cloud condensation nuclei (increase albedo) • Direct warming: • Absorb radiation • Indirect warming: • Cloud-aerosol interactions http://www.nature.com/scitable/knowledge/library/aerosols-and-their-relation-to-global-climate-102215345
IPCC (AR5) on aerosols • Relative forcing of total aerosol effect -0.9 (-1.9 − -0.1) Wm-2 • medium confidence • negative forcing from most aerosols • positive forcing from black carbon absorption • Aerosol/cloud interactions have offset a substantial amount of mean global forcing from GHGs • High confidence • Contribute largest uncertainty to total relative forcing estimate • Aerosols not as well mixed as greenhouse gases (GHGs) • more localized • amount in atmosphere varies, day to day, place to place
Direct radiative effect (DRE) Instantaneous radiative impact of all atmospheric particles on Earth’s energy balance (incoming net solar radiation vs. outgoing infrared radiation)
DirectRadiative Forcing (DRF) Change in DRE from pre-industrial to present-day (excluding feedbacks)
DRF • Direct radiative forcing (DRF): • “Radiative forcing is a measure of the influence a factor has in altering the balance of incoming and outgoing energy in the Earth-atmosphere system and is an index of the importance of the factor as a potential climate change mechanism. In this report radiative forcing values are for changes relative to preindustrial conditions defined at 1750 and are expressed in Watts per square meter (W/m2)” • Anthropogenic: rise in human emissions, land-use change • Natural: changes in solar flux, volcanic emissions • Does NOT include feedbacks resulting from changing climate • In this model, neglects ALL feedbacks • Change in primary aerosol emissions from anthropogenic activity • Impacts of changing chemical environment (due to anthropogenic emissions) on secondary aerosol formation
DRE vs. DRF • DRF quantifies the change in DRE over time which will induce a change in global temperatures • Radiative impacts of natural aerosols are typically reflected in DRE and not DRF • Treatment of secondary aerosol formation complicated: • Ex. Changes in the chemical formation of biogenic secondary organic aerosol due to changes in anthropogenic nitrogen oxide emissions qualify as a DRF • similar changes induced by changes in lighting NOx sources (due to climate feedback) do not
simulations • Baseline 2010 • Identical simulation with zero anthropogenic emissions • The difference between the two simulations provides an estimate of the anthropogenic burden, AOD and DRF • Projected out to 2100
Model • Chemical transport model (CTM): • driven by assimilated meteorology • Integrated online with the global GEOS-Chem (v9-01-03) chemical transport model (GCRT) driven by GEOS-5 • Year 2010 • 2° x 2.5° • 47 vertical levels • Rapid Radiative Transfer Model for GCMs (RRTMG): • correlated-k method to calculate longwave (LW) and shortwave (SW) atmospheric fluxes • Shown to be highly accurate in tests against reference radiative transfer calculations as part of the Continual Intercomparison of Radiations Codes (CIRC) project • AOD at a specific wavelength is calculated within GEOS-Chem as a function of local relative humidity from the mass concentration and mass extinction efficiency (MEE) • Uses aerosol optical depth (AOD), single scattering albedo (SSA), and asymmetry parameter (g) for each aerosol type to calculate aerosol impacts on rediative fluxes in both the shortwave and longwave
Model Scattering Absorption Aerosols treated as externally mixed with log-normal size distributions and optical properties (including refractive indices and growth factors) defined by the Global Aerosol Data Set (GADS) database
assumptions • Log-normal distribution • Refractive indices and growth factors defined by the Global Aerosol Data Set (GADS) database • Fixed effective radii: 14.2 μm water droplets, 24.8 μm ice particles • 20% of all dust is of anthropogenic origin • Biomass burning not included in anthropogenic emissions • Observations characterize total DRE of present-day aerosols • to estimate DRF the anthropogenic fraction is assumed • 2100: anthropogenic emissions of ozone and aerosol precursors follow RCP 4.5 • All other natural, fire emissions, methane concentrations are identical in 2010 and 2100
Representative concentration pathways (RCP) Emissions of aerosols and precursors decline sharply in 21st century for all RCPs • Global Anthropogenic Radiative Forcing for the high RCP8.5, the medium-high RCP6, the medium-low RCP4.5 and the low RCP3-PD • two supplementary extensions: • connecting RCP6.0 levels to RCP4.5 levels by 2250 (SCP6TO45) • RCP45 levels to RCP3PD concentrations and forcings (SCP45to3PD)
Aerosols produce a warming over the highly reflective hot spots over North America, the Middle East, and Greenland • In other regions aerosols are typically more scattering than the surface albedo resulting in cooling
Refresher • What is DRE? • Direct radiative effect: • Radiative impact of all atmospheric particles (natural and anthropogenic) on the Earth’s energy balance • What is DRF? • Direct radiative forcing: • Change in DRE from pre-industrial to present-day (not including climate feedbacks) • The difference? • Radiativeimpacts of natural aerosols are typically reflected in DRE and not DRF
results • Global radiative impact of natural aerosol is more than 4 times that of anthropogenic aerosol perturbation • total aerosol DRE: -1.83 Wm-2 • total aerosol DRF: -0.36 Wm-2 • Tropospheric aerosols exert a large influence on the global energy balance
Table 3: Global annual mean aerosol budget and impacts simulated for 2010 using GCRT • (comparisons with AEROCOM II means from Myhre et al., 2013 • [comparisons with AERCOM I medians from Kinne et al., 2006] • Note anthropogenic here does not include biomass burning Biomass burning not included DRE for all biomass burning particles: -0.19 Wm-2
Figure 2: Annual mean AOD (left), shortwave TOA clear-sky direct radiative effect (center) and longwave TOA clear-sky direct radiative effect (right) simulated by GCRT for 2010. Color bars are saturated at respective values.
OA SW TOA DRE Sulfate Sea salt BC Dust
LW TOA DRE OA Sea salt Dust
Figure 2: Annual mean AOD (left), shortwave TOA clear-sky direct radiative effect (center) and longwave TOA clear-sky direct radiative effect (right) simulated by GCRT for 2010. Color bars are saturated at respective values.
Total AOD SW TOA DRE LW TOA DRE Figure 2: Annual mean AOD (left), shortwave TOA clear-sky direct radiative effect (center) and longwave TOA clear-sky direct radiative effect (right) simulated by GCRT for 2010. Color bars are saturated at respective values.
Aerosols that are dominated by anthropogenic sources (e.g. nitrate) show a similar DRE and DRF whereas natural aerosols (e.g. sea salt) have a large DRE but zero DRF Figure 3. Top left: Global annual mean all-sky speciated aerosol TOA Direct Radiative Effect in 2010 (graph: blue) Top center: Direct Radiative Forcing for 2010 (Graph: dark grey) Top right: Direct Radiative Forcing for 2100 (graph: light grey)
Figure 5. Global seasonal mean speciated aerosol TOA (GCRT for 2010)
Average monthly aerosol aODfrom MODIS • AOD of 0.1 (pale yellow) indicates clear sky with little to no aerosols • AOD of 1 (brown) indicates hazy conditions http://upload.wikimedia.org/wikipedia/commons/7/72/MODAL2_M_AER_OD.ogv
Uncertainties • Uncertainty in MEE dominates uncertainties in DRF • assumptions in size, water uptake and absorption efficiency • Used to calculate AOD • BC coating not addressed • DRE and DRF values may underestimate absorption • Uncertainty in aerosol optics • Anthropogenically caused SOA likely underestimated • Anthropogenic dust • Poor understanding of natural particle emissions from ecosystems • Marine OA and methane sulfonate not included • Lack of measurements in remote areas • Indirect effects of aerosols (aerosol-cloud interaction) • Feedbacks difficult to attribute
feedbacks • Anthropogenic land use change and changes in the chemical environment affect natural aerosols (forcing) • Changes in natural aerosols are typically associated with climate feedbacks • Changes brought on by changing temperatures or precipitation • Ex. Dust emissions associated with changes in soil moisture or wind speed • changes induced by changes in lighting NOx sources (climate feedback) • Increased smoke from fire activity • Changes in aerosols driven by climate feedbacks may result in radiative perturbations up to ±1 Wm-2
Larger picture • Anthropogenic emissions of aerosols and their precursors are expected to continue to decline globally • DRF will also decrease • At the same time feedbacks from climate change on aerosols are likely to grow • DRF may not give full picture • Issues: • Anthropogenic land-use change and biomass burning not included • Climatic Feedbacks • Areas such as China and India are going to be increasing aerosols Thoughts or questions?
References • Chao, N. et al., 2014. Vehicular emissions in China in 2006 and 2010. Atmos. Chem. Phys. Discuss., 14(4): 4905-4956. • Heald, C.L. et al., 2013. Beyond direct radiative forcing: the case for characterizing the direct radiative effect of aerosols. Atmos. Chem. Phys. Discuss., 13(12): 32925-32961. • IPCC, 2013: Summary for Policymakers. In: Climate Change 2013: The Physical Science Basis. Contribution of Working Group I to the Fifth Assessment Report of the Intergovernmental Panel on Climate Change [Stocker, T.F., D. Qin, G.-K. Plattner, M. Tignor, S.K. Allen, J. Boschung, A. Nauels, Y. Xia, V. Bex and P.M. Midgley(eds.)]. Cambridge University Press, Cambridge, United Kingdom and New York, NY, USA. • Rotstayn, L.D., Collier, M.A., Chrastansky, A., Jeffrey, S.J., Luo, J.J., 2013. Projected effects of declining aerosols in RCP4.5: unmasking global warming? Atmos. Chem. Phys., 13(21): 10883-10905. • Smith, S.J., Bond, T.C., 2013. Two hundred fifty years of aerosols and climate: the end of the age of aerosols. Atmos. Chem. Phys. Discuss., 13(3): 6419-6453.