Download
1 / 16
160 likes | 307 Views
Radiative forcing - measured at Earth‘s surface - corroborate the increasing greenhouse effect. R.Philpona 1 , B.Dürr 1 , C.May 1 , A.Ohmura 2 and M.Wild 2 1 Physikalisch-Meteorologisches Observatorium Davos, World Radiation Center, Davos Doerf, Switzerland

E N D
Radiative forcing - measured at Earth‘s surface - corroborate the increasing greenhouse effect R.Philpona1, B.Dürr 1, C.May1, A.Ohmura2 and M.Wild2 1 Physikalisch-Meteorologisches Observatorium Davos, World Radiation Center, Davos Doerf, Switzerland 2 Institute for Atmospheric and Climate Science, Swiss Federal Institute of Technology (ETH), Zürich, Switzerland Geophysical Research Letters, Vol.31, L03202, 2004
Radiative Budget of the Earth atmosphere Detailed overview of the earth atmosphere energy balance. Left hand side the incoming solar radiation, right hand side the outgoing infrared radiation.
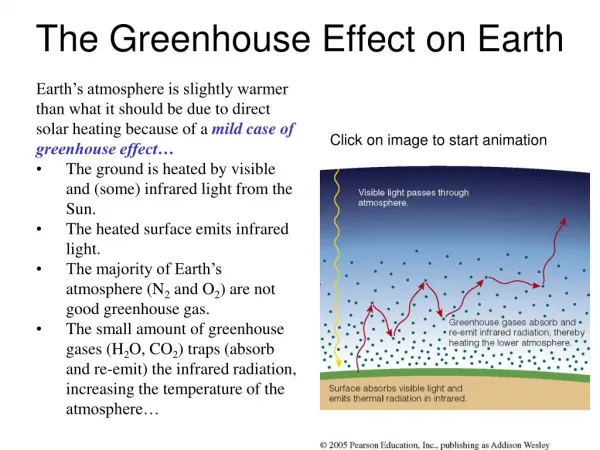
Radiative Balance At the top of the atmosphere, the expenditure all incident solar radiation must be accounted for the Earth as a whole, that is, the net incoming solar radiation must be balanced by the outgoing longwave radiation.
Forcing |FTs| - |FTT| FTs FTT tropopause FTs Fss FST FsT FSL surface IPCC2001 - Definition of (RT) Radiative Forcing • The IPCC used the following definition, focusing on topopause level conditions: • RT is the change in the net vertical irradiance (Wm-2) at the tropopause due to an internal change or a change in the external forcingof the climate system, such as, for example, • a change in the concentration of carbon dioxide • or water • aerosols • the output of the Sun. • Usually RT is computed after allowing forstratospheric temperatures to readjust to radiative equilibrium, but with all tropospheric properties held fixed at their unperturbed values.
The Alpine Surface Radiation Budget (ASRB) Network Measurements: - Temperature - Humidity - Longwave radiation(LW) - Shortwave radiation(SW)
Longterm measurements Temperature abs. Humidity • From 1980-2002: T= +1.32(0.5)°C H= + 0.51(0.2)gm-3 • From 1995-2002: T= +0.82(0.4)°C H= +0.21(0.1)gm-3 H[gm-3] T[°C] 1995-2002: • LW downward radiation (LDR) 5 to 8 Wm-2 : +5.2(2.2) Wm-2• SW downward radiation (SDR) -0.5 to -6 Wm-2: -2.0(3.7) Wm-2
Corrections • • Theory: • LDR increase with increasing greenhouse gases • • Problem: • LDR increase also with increasing cloud amount, temperature and water vapour (humidity). • Corrections required to account for changing • a.) cloud cover • b.) temperature • c.) humidity
Correction a.) Cloud Cover We define a CSI (Cloud Sky Index) index: Atmosphere as a grey body: emittance eA = LW / sTa4 Clear-sky emittance: - Brutsaert-formula: eAC=k(ea/Ta)1/7 - Modified (altitude dependence): eAC(H)=eAD+k(ea/Ta)1/8 with ea : water vapore pressure [Pa] Ta : air temperature [K] k : location dependent coefficient from selected clear-sky cases eAD : altidude dependent clear-sky emittance for a dry atmosphere CSI = eA/eAC(H)
Correction a.) Cloud Cover CSI = eA/eAC(H) CSI 1 : clear-sky, no clouds CSI > 1 : cloudy-sky, overcast LDRclfr=LDR-LCE LDR = +5.2(2.2) Wm-2 LCE = +1.0(2.8) Wm-2 (due to changing cloud cover) LDRclfr = +4.2(1.9) Wm-2 (Total LW change) SDRclfr = -1.0(3.7) Wm-2 (blocking of sunlight) Total effect: = 5.2(1.9) Wm-2
Correction b.) (T) and c.) (H) Realtive correction for T and H is obtained from GCM modelling based ECHAM-4 GCM: Measurements: 3.3% CO2 increase (Central Europe) 1/3 of LDR increase (5.2 W/m2) is due to greenhouse gases, i.e. 5.2 W/m2/3 = ~1.73 W/m2 2/3 of LDR increase is due to temperature and humidity variation, i.e. i.e. 5.2 W/m22/3 = ~3.46 W/m2
Temperature Corretion b.) Temperature changes due to external warm air advection must be substracted from LDRcf. Correction : LDRclfr,tc = LDRclfr -DLDRt With temperature driven change in LDR: DLDR= 4sTa3DtaeACs: Stefan Boltzmann constant Ta: average temperature at the station Dta:temperature trend (2/3) => LDR clfr,tc = 2.1 to 2.9 Wm-2 : mean: +2.4 (0.9)Wm-2 Temperature
Humidity Correction c.) MODTRAN simulation of LW : +0.56 Wm-2 (500m) (water vapor 0.1 gm-3 increase): +1.7Wm-2 (3000m) Only 1/3 of measured vater vapor increase is due to green-house gases: modelled LW increase: + 0.44 Wm-2 MODTRAN simulation: +1.58 Wm-2 LW on average over 8 years due to greenhouse gases Correction of LDR cf,tc with 2/3 of LW increase due to humidity increase remaining increase of LW : +1.8 (0.8) Wm-2
LDR measurement Summary [Wm-2] Longwave Cloud Effect LDRcf (cloud free) - = +5.2(2.2) +1.0(2.8) +4.2(1.9) LDRcf (cloud free) LDRcf,tc,uc(hum.corr.) LDRcf,tc (temp.correction) +4.2(1.9) +1.8(0.8) +2.4 (0.9)
Conclusions • Longwave flux increase +5.2(2.2) Wm-2 measured over 8 years. • 1/3 of LDR increase is due to greenhouse gases • After correction (clouds, temperature, humidity) cloud-free longwave flux increase +1.8 (0.8) Wm-2 due to greenhouse gases • MODTRAN simulation predicts +1.58 Wm-2 direct observation of LW radiative forcing due to greenhouse gases