Download
1 / 45
450 likes | 689 Views
Chapter 12.1. The causes of weather. Meteorology. Study of atmospheric phenomena Weather- day to day variations Climate- average weather over a long period of time. How is solar radiation is distributed around the planet? Sun feels hotter in the tropics. Why?

E N D
Chapter 12.1 The causes of weather
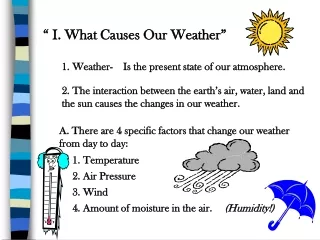
Meteorology • Study of atmospheric phenomena • Weather- day to day variations • Climate- average weather over a long period of time
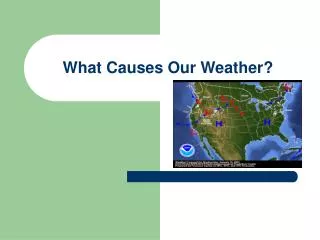
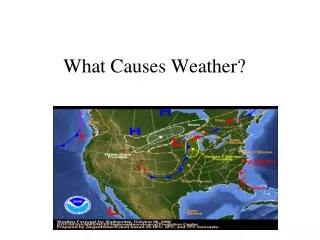
How is solar radiation is distributed around the planet? • Sun feels hotter in the tropics. Why? • Because the Sun’s rays are more spread out when they strike Earth at a low angle, the same amount of energy is spread over a larger area
All weather is part of a constant redistribution of Earth’s heat energy—the continual motion of air and water reallocates • Heat energy among Earth’s surface, oceans, and atmosphere and balances it
Air Masses • Large body of air classified according to its source region • warm and dry continental tropical (cT) • warm and humid maritime tropical (mT) • cold and dry continental polar (cP) • cold and humid maritime polar (mP) • arctic (A)
Air Mass Modification • Heat transfers from one area to another establishing a heat balance. • As an air mass moves, it acquires some of the characteristics of the new surface beneath it.
The Causes of Weather Section Assessment 1. Match the following terms with their definitions. ___ meteorology ___ weather ___ climate ___ air mass ___ air mass modification A. the current state of the atmosphere B. the study of atmospheric phenomena C. the average weather over a long period of time D. the exchange of heat or moisture with the surface over which an air mass travels E. a large body of air that takes on the characteristics of an area over which it forms B A C E D
The Causes of Weather Section Assessment • Identify the winter characteristics of each air mass. ___ A ___ cP ___ cT ___ mP ___ mT A. warm, humid B. bitter cold, dry C. cold, humid D. mild, humid E. warm, dry F. very cold, dry B F E C A
Chapter 12.2 Weather SYstems
Coriolis Effect • Particles of air are deflected to the right in the N. hem. and to the left in the S hem. (due to Earth’s rotation) • The Coriolis effect & heat imbalances create distinct global wind systems that mix colder and warmer air masses.
Global Wind Systems • Trade winds- flow at 30° N and S latitude, where air sinks, warms, and returns to the equator in a westerly direction.
Other Wind Zones • The prevailing westerlies, the second major wind zone, flows between 30° and 60° N and S latitude in a circulation pattern opposite that of the trade winds. (US, Canada) • The polar easterlies, the third major wind zone, lies between 60° latitude and the poles. (cold)
Jet Streams • Narrow bands of high-altitude, westerly winds that flow at speeds up to 185 km/h at high elevations of 10.7 km to 12.2 km. • They are the strongest core of westerly winds. • Weather systems generally follow the path of the jet streams.
Fronts • Narrow region separating two air masses of different densities that are caused by differences in temperature, pressure, and humidity. • Cause dramatic changes in weather. • 4 main types…
Cold Fronts • cold, dense air displaces warm air & forces the warm air to rise steeply • Cause clouds, showers, and sometimes thunderstorms • Ex: solid blue line with blue triangles that point in the direction of the front’s motion.
Warm Fronts • advancing warm air displaces cold air with a gradual frontal slope • characterized by lots of cloudiness & precipitation. • Ex: solid red line with red semicircles pointing in the direction of the front’s motion.
Stationary Fronts • Two air masses meet and stall. • Seldom have extensive cloud & heavy precipitation patterns. • represented by a combination of short segments of cold- and warm-front symbols.
Occluded Fronts • A cold air mass overtakes a warm front, wedging the warm air upward. • Precipitation is common on both sides of an occluded front. • Alternating purple triangles and semicircles that point toward the direction of motion.
Pressure Systems • At Earth’s surface, rising air is associated with low pressure and sinking air is associated with high pressure. • Rising or sinking air, combined with the Coriolis effect, results in the formation of rotating low- and high-pressure systems in the atmosphere. • Air in these systems moves in a general circular motion around either a high- or low-pressure center.
Pressure Systems High-Pressure Systems • In a high-pressure system, air sinks, so that when it reaches Earth’s surface it spreads away from the center.
Pressure Systems Low-Pressure Systems • In a low-pressure systems, air rises, causing an inward net flow toward the center and then upward.
Pressure Systems Low-Pressure Systems • A wave cyclone tends to produce inclement weather usually begins along a stationary front. • Parts of it move south as a cold front and north as a warm front in a counterclockwise or cyclonic circulation.
Section Assessment 1. Match the following terms with their definitions. ___ Coriolis effect ___ trade winds ___ jet streams ___ front A. narrow bands of high-altitude, westerly winds that flow at high speeds B. the narrow region separating two air masses of different densities C. the major wind zones that occur at 30° north and south latitude D. a result of Earth’s rotation that causes moving particles such as air to be deflected to the right in the northern hemisphere and to the left in the southern hemisphere D C A B
Section Assessment 2. Identify whether the following statements are true or false. ______ Low pressure systems are usually associated with fair weather. ______ A stationary front occurs when two air masses meet and stall. ______ In general, weather patterns follow the jet streams. ______ The overall circulation in a low-pressure system always rotates in a clockwise direction. false true true false
Chapter 12.3 Gathering weather data
Gathering Weather Data • Meteorologists measure temperature, air pressure, wind, & relative humidity to make weather forecasts. • Two of the most important factors in weather forecasting are the accuracy and frequency of the data.
Surface Data • Thermometer- measures temperature. • Barometer- measures air pressure. • Hygrometer (phsychrometer)- measures humidity • Anemometer- measures wind speed. • Ceilometer- measures height & amount of cloud cover
Upper-Level Data • To make accurate forecasts, meteorologists must gather atmospheric data at heights of up to 30 000 m. • Radiosonde- sensorsattached to a weather balloon to measure upper level data and wind speeds.
Weather Radar • A weather radar system is used to pinpoint where rain is falling. • The system transmits and displays electromagnetic waves that bounce, or scatter, off of large raindrops.
Doppler Radar • Doppler effect- the change in wave frequency that occurs in energy, such as sound or light, as that energy moves toward or away from an observer. • Meteorologists use Doppler radar estimate speed and direction of winds during storms including those that are experiencing severe weather such as thunderstorms and tornados.
Doppler Effect As the train approaches, the sound waves ahead of it are compressed. These shorter waves have a high frequency, so the horn sounds high. Behind the train, the sound waves are stretched out. These longer waves have a lower frequency, so the horn sounds lower.
Weather Satellites • One of the main uses of satellites in orbit around Earth is to observe weather. • Cameras mounted aboard a weather satellite take photos of Earth at regular intervals.
Infrared Imagery • Weather satellites use both visible light and invisible radiation to observe the atmosphere. • Infrared imagery detects differences in thermal energy • Because the strength of a storm is related to its height, infrared imagery can be used to establish a storm’s potential to produce severe weather.
Gathering Weather Data Section Assessment 1. Match the following terms with their definitions. ___ thermometer ___ barometer ___ anemometer ___ hygrometer ___ ceilometer A. an instrument that measures air pressure B.an instrument that measures the height of cloud layers and estimates the amount of sky covered by clouds C.an instrument that measures wind speed D. an instrument that measures temperature E. an instrument that measures relative humidity D A C E B
Chapter 12.4 Weather analysis
Station Model • a record of weather data for a particular site at a particular time. • Symbols are used to represent weather data in a station model.
Surface Analysis • To plot data nationwide or globally, meteorologists use isopleths. • Isopleths- lines that connect points of equal value, such as pressure or temperature. • Lines of equal pressure are called isobars. • Lines of equal temperature are called isotherms.
Surface Analysis • You can tell how fast wind is blowing in an area by noting how closely isobars are spaced. • Isobars - close together indicate a large pressure difference over a small area = strong winds. • Isobars spread far apart indicate a small difference in pressure which equates to light winds.
Surface Analysis • Isobars also indicate the locations of high- and low-pressure systems. Of the states listed below, which is the windiest? ___ California ___ Texas ___ Missouri ___ South Carolina
Short-Term Forecasts • Weather systems change directions, speed, and intensity with time in response to changes in the upper atmosphere. • A reliable forecast must analyze data from different levels in the atmosphere. • A digital forecast, most used today, is a forecast that relies on numerical data.
Short-Term Forecasts • An analog forecast involves comparing current weather patterns to patterns that took place in the past. Can you name an example? • Farmer’s Almanac
Long-Term Forecasts • What do you notice about uncertainty as forecasts are made further in advance?
Things to remember about forecasts… • The most accurate and detailed forecasts are short-term in nature. Less Accurate! Forecasts in the one- to three-day range are the most accurate. Accuracy Declines with Time! More Accurate!
Don’t blame the weatherman! (or woman) • Meteorologists rely on computer generated models to predict the weather. Sometimes they will have many different models with different predictions, which is where experience, training and their education come into play. It is an imperfect science, to say the least.
Weather Analysis Section Assessment 1. Match the following terms with their definitions. ___ station model ___ isopleths ___ digital forecast ___ analog forecast A. lines that connect points of equal or constant values B. a forecast that relies on numerical data C. a record of weather data for a particular site at a particular time D. a forecast that involves comparing current weather patterns to patterns that took place in the past C A B D