Download
1 / 18
180 likes | 354 Views
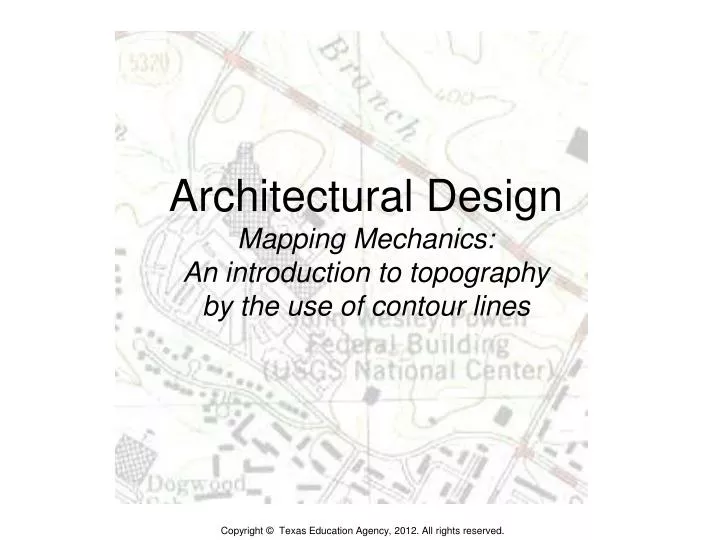
Architectural Design Mapping Mechanics: An introduction to topography by the use of contour lines . Lesson Objectives. Upon completion of this lesson, students will be able to: define topography define the USGS and different techniques used to study topography

E N D
Architectural DesignMapping Mechanics: An introduction to topography by the use of contour lines
Lesson Objectives • Upon completion of this lesson, students will be able to: • define topography • define the USGS and different techniques used to study topography • discuss different scales and relevant uses for common scales of maps found in the United States • accurately construct a scale/ grid • define and discuss contour lines • manipulate contour lines • from given contour select part or all and copy and place contour on given grid you have made or selected • construct profiles within the contoured map or place in points • locate the proper elevations of objects • identify common symbols used in mapping • 6. identify the different contour maps and use profile views that are given
Topography: (topo-, "place", and graphia, "writing") is the study of Earth's surface features or those of planets, moons, and asteroids.In a broader sense, topography is concerned with local detail in general, including not only relief but also vegetative and human-made features, and even local history and culture. This meaning is less common in America, where topographic maps with elevation contours have made "topography" synonymous with relief. Topography specifically involves the recording of relief or terrain, the three-dimensional quality of the surface, and the identification of specific landforms. This is also known as geomorphometry. In modern usage, this involves generation of elevation data in electronic form. It is often considered to include the graphic representation of the landform on a map by a variety of techniques, including contour lines, Hypsometric tints, and relief shading.[1][2][3]This lesson plan will focus on understanding the fundamentals of mapping by manipulating contour lines.
USGSThe United States Geological Survey (USGS) is a scientific agency of that governs the use of our mapping data.The scientists of the USGS study the landscape of the United States, its natural resources, and the natural hazards that threaten it. According to the USGS there are different techniques to studying topography. Which methods to use depend on the scale and size of the area under study, its accessibility, and the quality of existing surveys. Listed below are examples:Direct survey Remote sensing Photogrammetry Radar and sonar
Scales • The USGS produces several national series of topographic maps which vary in scale and extent, with some wide gaps in coverage. • The largest (both in terms of scale and quantity) and best-known topographic series is the 7.5-minute, 1:24,000 scale, quadrangle, a non-metric scale virtually unique to the United States. • Each of these maps covers an area bounded by two lines of latitude and two lines of longitude spaced 7.5 minutes apart. Nearly 57,000 individual maps in this series cover the 48 contiguous states, Hawaii, U.S. territories, and areas of Alaska near Anchorage, Fairbanks, and Prudhoe Bay. • Other common scales are 1:50,000 (used by the military during its attack on Iraq in 2003), 1:100,000, and the 1:250,000 (commonly used by the Air Force for planning purposes).
Topographic Map and Contour Lines • Topographic map: type of map characterized by large-scale detail and quantitative representation of relief, usually using contour lines in modern mapping, but historically using a variety of methods. Traditional definitions require a topographic map to show both natural and man-made features. • Topographic maps are also commonly called contour maps or topo maps. In the United States, where the primary national series is organized by a strict 7.5 minute grid, they are often called topo quads or quadrangles. • Topographic maps conventionally show topography, or land contours, by means of contour lines. • Contour lines are curves that connect contiguous points of the same altitude (isohels). In other words, every point on the marked line of 100 m elevation is 100 m above mean sea level. • These maps usually show not only the contours, but also any significant streams or other bodies of water, forest cover, built-up areas or individual buildings (depending on scale), and other features and points of interest.
STORYBOARD A. Construct a topographic grid chart - (1 to 40), (.25 to .25), or (1 to 20). You choose. Record elevations, as given. B. See EXAMPLE 1 - a land formation for a given city. You may use this to form your own topographic map. C. See topographic site box. D. See EXAMPLE 2 - A plotted relief map (height elevations given). Copy and put into CAD, zoom in. Contour lines, circle all like numbers as shown in next slide. Use given symbols and finish profile A-B also shown in next slide.
STORYBOARD E. Finish the following topographic map by:1.locating the points of profile chart A-B that show the height of given contour lines.2. using the cutting plane line and projecting lines straight down to given height that corresponds with the crossing of cutting line A-B (as shown). 3. finishing cross section of mound. In profile chart A-B you can zoom in by changing %.
STORYBOARD F. Finish the following topographic map (cont’d) by: 4. labeling contour lines. 5. placing contour A-B wherever you want, then finishing height of given land formation. 6. coloring it, shading it, and forming a table showing given corresponding color with given height line. 7. graphing it, as shown in other drawing. 8. zooming in by changing % of zoom, then copying and pasting into CAD. G. Finished contour map - make a table that corresponds with graph and height elevation as shown in profile chart A-B, basedon each contour line and given color. ZOOM IN. H. Color and put in height elevations as shown in previous topographic map.
Construct a topographic grid chart - (1 to 40), (.25 to .25), or (1 to 20). You choose. Record elevations, as given.
EXAMPLE 1This is a land formation for a given city. You may use this to form your own topographic map.
EXAMPLE 2A plotted relief map (height elevations given). Copy and put into CAD, zoom in. Contour lines, circle all like numbers as shown in next slide. Use given symbols and finish profile A-B also shown in next slide.
Finish the following topographic map by:1. locating the points of profile chart A-B that show the height of given contour lines. 2. using the cutting plane line and projecting lines straight down to given height that corresponds with the crossing of cutting line A-B (as shown). 3. finishing cross section of mound. In profile chart A-B you can zoom in by changing %.
Finish this topographic map (con’d.) by: 4. labeling contour lines. 5. placing contour A-B wherever you want, then finishing height of given land formation. 6. coloring it, shading it, and forming a table showing given corresponding color with given height line. 7. graphing it, as shown in other drawing. 8. zooming in by changing % of zoom, then copying and pasting into CAD.
Finished Contour Map In this drawing make a table that corresponds with graph and height elevation as shown in profile chart A-B, basedon each contour line and given color. ZOOM IN.
Color and put in height elevations as shown in previous topographic map.