Download
1 / 39
400 likes | 646 Views
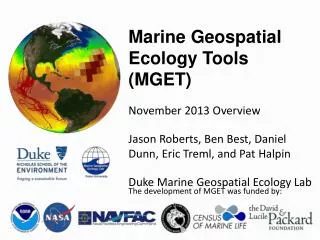
Marine Geospatial Ecology Tools Jason Roberts, Ben Best, Dan Dunn, Eric Treml and Pat Halpin Duke Marine Geospatial Ecology Lab. The development of MGET was funded by:. MGET is an ArcGIS toolbox. It can also be invoked from most programming languages. Over 250 Tools.

E N D
Marine Geospatial Ecology Tools Jason Roberts, Ben Best, Dan Dunn, Eric Treml and Pat Halpin Duke Marine Geospatial Ecology Lab The development of MGET was funded by:
MGET is an ArcGIS toolbox It can also be invoked from most programming languages Over 250 Tools
MGET is used worldwide ~2300 installs since August 2009 81 countries (map is missing 25)
More MGET facts • Free, open-source software • Requires Windows and ArcGIS • These requirements are slowly disappearing • Easy installation (“just click Next, Next, Next”) • Written in Python, R, MATLAB, and C/C++ • Uses free MATLAB Component Runtime
Tour of the tools Let’s see some examples from each toolset…
MGET supports a growinglist of products and algorithms Let’s look at some examples…
Easily acquire oceanographicdata in GIS-compatible formats • MGET provides customized tools for each data product that it supports • The tool shown here is a simple one: it downloads ocean color data in a GIS-compatible format • This may seem trivial but GIS users regularly cite data import as 80% of the work of any project
Sample 3D and 4D products Chai, F, RC Dugdale, TH Peng, FP Wilkerson, and RT Barber (2002). One-dimensional ecosystem model of the equatorial Pacific upwelling system. Part I: model development and silicon and nitrogen cycle. Deep Sea Research Part II: Topical Studies in Oceanography 49: 2713-2745.
Leatherback Track Video(click link above while viewing slide show)
Leatherback movement modeling Schick et al (2008) Bayesian animal movement model Schick, RS, JJ Roberts, SA Eckert, PN Halpin, H Bailey, F Chai, L Shi, and JS Clark (in prep). Pelagic movements of Pacific Leatherback Turtles (Dermochelyscoriacea) reveal the complex role of prey and ocean currents.
Detecting SST fronts • MGET provides tools that detect oceanographic features in remote sensing images • These are some of the most popular tools in MGET Aqua Terra
Daytime SST 03-Jan-2005 Cayula & Cornillon algorithm Mexico Step 1: Histogram analysis ArcGIS model Bimodal Optimal break 27.0 °C Frequency Temperature Example output Step 2: Spatial cohesion test 28.0 °C Mexico Front 25.8 °C Strong cohesion front present Weak cohesion no front ~120 km
Application: albatross habitat suitability SST Front Activity Index Žydelis, R, RL Lewison, SA Shaffer, JE Moore, AM Boustany, JJ Roberts, M Sims, DC Dunn, BD Best, Y Tremblay, MA Kappes, PN Halpin, DP Costa, and LB Crowder (2011) Dynamic habitat models: Using telemetry data to project fisheries bycatch. Proceedings of the Royal Society B. doi:10.1098/rspb.2011.0330
Miller’s composite front maps Areas of Additional Pelagic Ecological Importance (AAPEI) Summer frequent front map FF Miller P, et al. (in review) Frequent locations of ocean fronts as an indicator of pelagic diversity: application to marine protected areas and renewables CSF UF %
Detecting mesoscale eddies • This tool detects eddies in SSH images collected by NASA/CNES radar altimeters
Gulf stream eddies Image from http://www.oc.nps.edu/
Okubo-Weiss eddy detection SSH anomaly Example output Aviso DT-MSLA 27-Jan-1993 Red: Anticyclonic Blue: Cyclonic Negative W at eddy core
Eddy Detection Video(click link above while viewing slide show)
Application: fisheries ecology • Are tuna and swordfish catches in the northwest Atlantic correlated with eddies? Eddies Hsu A, Boustany AM, Roberts JJ, Halpin PN (in review) The effects of mesoscale eddies on tuna and swordfish catch in the U.S. northwest Atlantic longline fishery. Fish. Oceanogr.
Results A = In anticyclonic eddies C = In cyclonic eddies N = Not in eddies + = positively correlated with CPUE ̶ = negatively correlated with CPUE For tunas, CPUE is higher inside eddies than outside eddies (p < 0.05) For swordfish, CPUE is lower inside eddies than outside eddies (p < 0.05)
Chelton’s eddy database • MGET also includes tools that provide easy access to data products published by other NASA grantees • By improving access to these products from GIS, we hope to increase use by ecologists Chelton, DB, MG Schlax, and RM Samelson (2011). Global observations of nonlinear mesoscale eddies. Progress in Oceanography 91: 167-216.
Querying OBIS • Query OBIS’s ~30 million records • Filter by taxon, bounding box, dates, etc. • Download results as GIS point features
Temporal periodicity analysis for swordfish • Top histogram shows how CPUE varies over time • Periodogram shows periods of cycles detected in the data • First find large spikes, then look up period on x axis • Important periods: • 365 days: annual cycle • 29.5 days: lunar cycle • 1 day: diurnal cycle • Radial histograms shows CPUE by day of year and lunar phase 365 days annual cycle
Sparse data for bluefin noisy periodogram Possible lunar and seasonal patterns Noise due to sparse data – ignore! Bigeye CPUE highest in full moon Annual harmonics at 121 and 91 days: short season
How does this work? • How do we identify cycles in complicated-looking data? CPUE
We use methods such as the Discrete Fourier Transform (DFT) to decompose the original signal into a series of sine waves that, when added together, reproduce it. • The MGET tool uses the Lomb-Scargle method, developed by astronomers to find cycles in phenomena that are only observed infrequently (e.g. rotating stars) 3 component signals Original signal
Model larval connectivity Ocean currents data Larval density rasters Habitat patches Tool downloads data for the region and dates you specify Edge list feature class representing dispersal network
Larval Dispersal Video 1Larval Dispersal Video 2(click links above while viewing slide show)
Model species habitat Probability of occurrence predicted from environmental covariates Point observations of species Predictive model Gridded environmental data Binary classification Bathymetry SST Chlorophyll
Application: rockfish habitat models Young MA, Iampietro PJ, Kvitek RG, Garza CD (2010) Multivariate bathymetry-derived generalized linear model accurately predicts rockfish distribution on Cordell Bank, California, USA. Marine Ecology Progress Series 415: 247–261.
Acknowledgements A special thanks to the many developers of the open source software that MGET is built upon, including: Guido van Rossum and his many collaborators; Mark Hammond; Travis Oliphant and his collaborators; Walter Moreira and Gregory Warnes; Peter Hollemans; David Ullman, Jean-Francois Cayula, and Peter Cornillon; Stephanie Henson; Tobias Sing, Oliver Sander, NikoBeerenwinkel, and Thomas Lengauer; Frank Warmerdam and his collaborators, Howard Butler; Timothy H. Keitt, Roger Bivand, EdzerPebesma, and Barry Rowlingson; Gerald Evenden; Jeff Whitaker; Roberto De Almeida and his collaborators; Joe Gregorio; David Goodger and his collaborators; Daniel Veillard and his collaborators; Stefan Behnel, MartijnFaassen, and their collaborators; Paul McGuire and his collaborators; Phillip Eby, Bob Ippolito, and their collaborators; Jean-loupGailly and Mark Adler; the developers of netCDF; the developers of HDF Thanks to our funders:
Thanks for coming! Download MGET: http://mgel.env.duke.edu/mget (or Google “MGET”) Email me: jason.roberts@duke.edu If you use MGET, please cite our paper: Roberts, JJ, Best BD, Dunn DC, Treml EA, Halpin PN (2010) Marine Geospatial Ecology Tools: An integrated framework for ecological geoprocessing with ArcGIS, Python, R, MATLAB, and C++. Environmental Modelling & Software 25: 1197-1207.